- Sales down 15.2% at €37.7 billion
- Organic sales down 12.7%
- Basic earnings per share at -€4.81
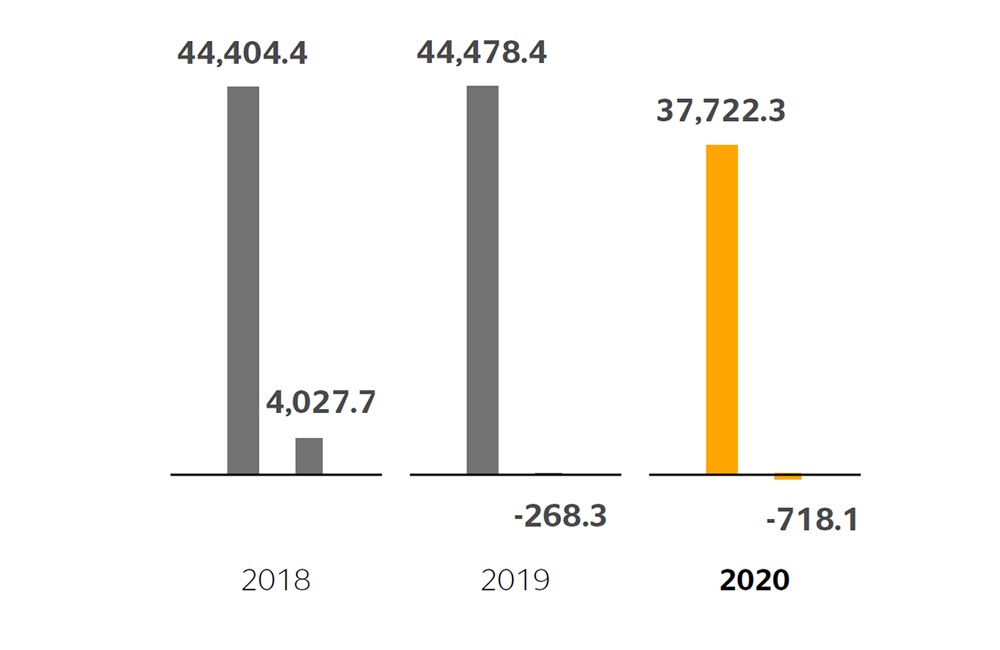
Sales; EBIT (€ millions)
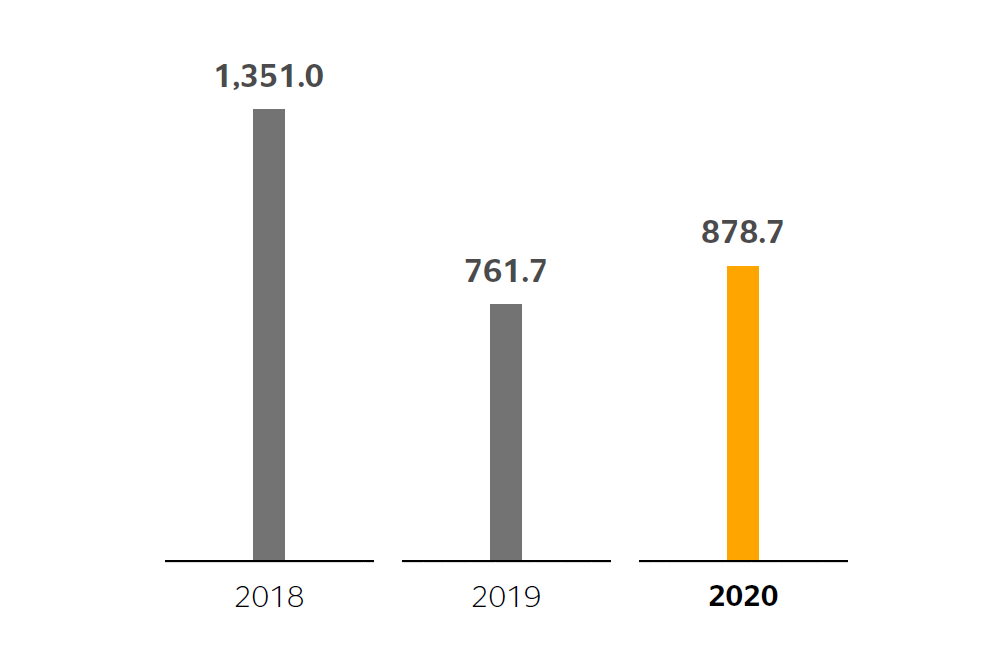
Free cash flow (€ millions)
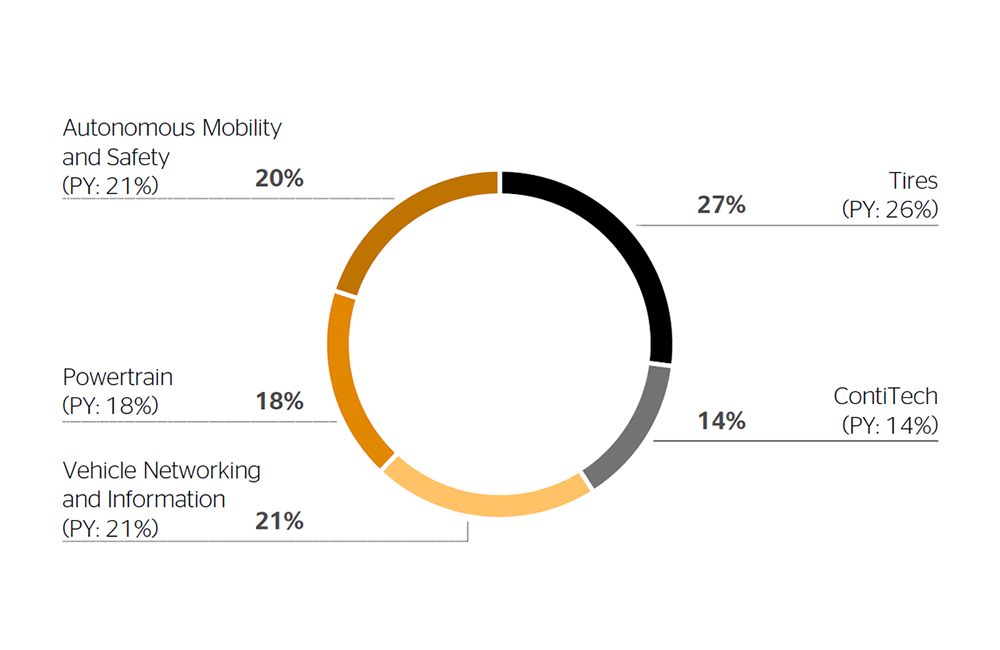
Sales by business area (%)
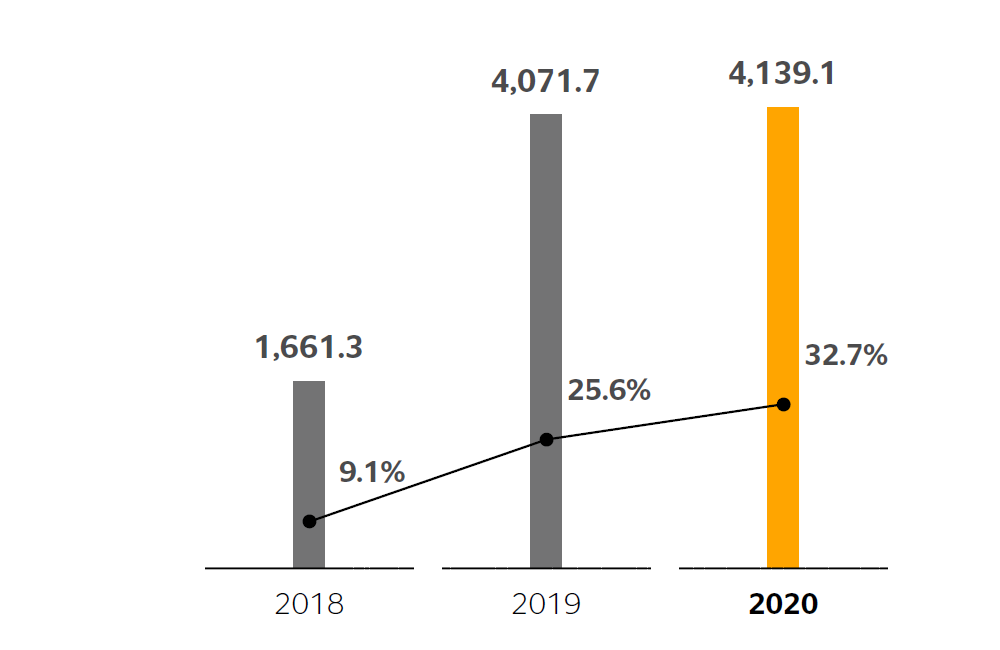
Net indebtedness (€ millions) / Gearing ratio (%)
Compared to the pdf-version the following chapters are not included here:
- Earnings, Financial and Net Assets Position [pp. 65-92]
- Continental AG (Short Version in acc. with HGB) [pp. 93-95]
- Other Information [pp. 96-98]
- Notes to the Consolidated Financial Statements [pp. 129-215]