

46.3% decrease in Continental share price.
Heavy turbulence on capital markets
Thanks to good U.S. economic data, the U.S. benchmark indexes continued their multi-year upward trend at the start of 2018. The rally on the U.S. stock markets caused share prices in Europe and Asia to rise as well. At the end of January 2018, the indication by the U.S. Federal Reserve (Fed) that it would implement three interest-rate hikes in 2018 and three in 2019 led, however, to fears of rising interest rates and prompted prices to fall on the U.S. bond markets. Prices on the stock markets in the U.S.A., Europe and Asia also consequently recorded substantial losses of up to one-tenth. After a temporary stabilization in the second half of February, the announcements by the U.S.A. that it would impose import tariffs on steel and aluminum products and on various Chinese products caused prices to fall again on the stock markets in March.
In early April 2018, reports of willingness on the part of the U.S. and Chinese governments to negotiate in the trade conflict ushered in a recovery phase on the stock markets. At the end of May, the U.S. government’s announcement that it was examining import tariffs on cars took the global stock markets by surprise and had a particularly negative impact on the share prices of automotive manufacturers. The failure to form a government in Italy also provoked fears of a new euro crisis. At the start of June, another upswing in U.S. technology stocks brought about an improvement in general sentiment on the markets. European stocks also benefited from the announcement by the European Central Bank (ECB) that it would not change its key interest rate, keeping it at 0.0% until well into 2019, and that it would only scale back its bond-buying program significantly. However, the U.S. government’s announcement that it would enforce extensive import tariffs on Chinese goods in the third quarter unsettled the stock markets again in the second half of June.
In July 2018, the stock markets in the U.S.A. and in Europe stabilized thanks to data reflecting a good economic trend. There were also positive effects at the end of July when the U.S.A. and the EU agreed for the time being that they would not introduce any new import tariffs and that they wanted to reduce existing ones in the future. This was followed at the end of August by the new trade deal, which is still to be approved by U.S. lawmakers, between the U.S.A. and Mexico, which Canada later accepted as well. During the quarter, U.S. stock markets reached record levels again, boosted by the continuing rise in U.S. technology stocks. By contrast, the European stock markets were negatively impacted in August and September by weaker economic data, new concerns about Italy’s budget policy, increasing depreciation of the currencies of several emerging countries, particularly Turkey, and further escalation of the trade dispute between the U.S.A. and China.
In the fourth quarter of 2018, rising interest rates in the U.S.A., further escalation of the trade conflict between the U.S.A. and China, and weaker economic data and expectations for the global economy caused prices to fall significantly on stock markets around the world. In Europe, the rejection of the Italian government’s budget proposal by the European Commission in late October and the postponement of the UK parliament’s vote on the negotiated EU withdrawal agreement in November also caused lasting uncertainty among investors. There were also several profit warnings from European and U.S. companies. In December, U.S. technology stocks in particular plunged and the Dow Jones dropped around 15% by Christmas. It then recovered slightly to end the year 5.6% down at 23,327.46 points. The DAX fell by around 2,000 points in the fourth quarter and ended the year at 10,558.96 points. Compared to the start of 2018, it was down 18.3%. The EURO STOXX 50 decreased 14.3% year-on-year, closing the year at 3,001.42 points.
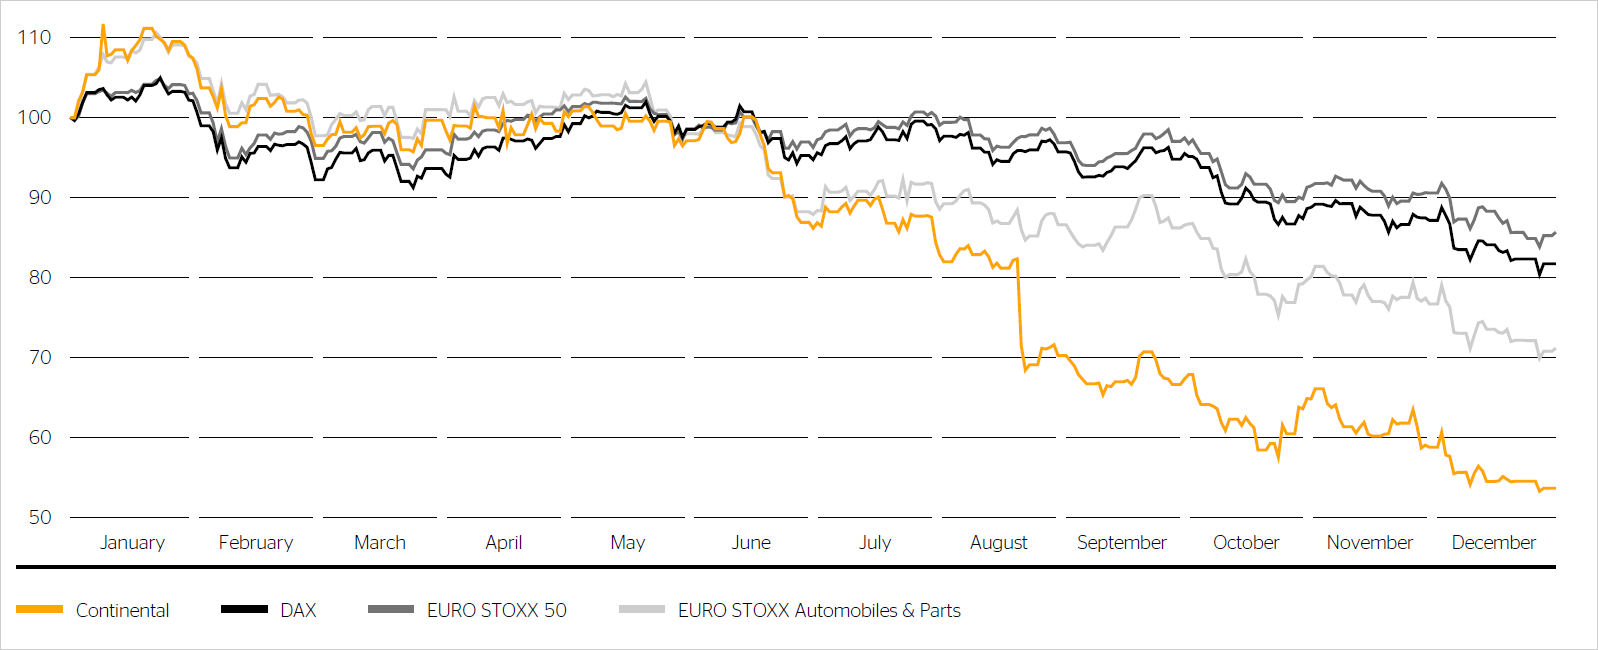
Price performance of Continental shares in 2018 versus selected stock indexes
(indexed to January 1, 2018)
Automotive stock prices decline in reporting year
European automotive and supplier stocks benefited in January 2018 from the generally positive market sentiment, several buy recommendations from various analysts, and companies’ initial business figures for the fourth quarter of 2017. However, the stocks were also dragged down during the first quarter of 2018 by the general market turbulence, declining sales and production figures for the U.S. and European car markets as well as the threat of bans on diesel cars.
In the second quarter of 2018, the European automotive sector initially benefited from the general price recovery and from the Chinese government’s announcement that it would lower its import tariffs for foreign automotive manufacturers from 25% to 15% starting in July. The U.S. government’s announcement that it was examining import tariffs on cars ended the recovery phase and resulted in falling share prices of automotive manufacturers and suppliers worldwide in late May. In addition to the escalation in the trade conflict between the U.S.A. and China, reports from German automotive manufacturers regarding constraints of their production as a result of the transition to the new exhaust-gas test procedure WLTP (Worldwide Harmonized Light Vehicles Test Procedure) and several profit warnings for German automotive manufacturers and suppliers caused a significant slump in the sector in the second half of June.
In July 2018, stocks in the European automotive sector initially recovered as a result of the general market stabilization and thanks to the avoidance of U.S. import tariffs on European cars. Over the remainder of the third quarter of 2018, however, profit warnings in the automotive sector once again caused share prices to fall. The main reasons cited in the warnings were lower production volumes in Europe as a result of the transition to WLTP and declining sales and production volumes in China.
These two effects and further profit warnings from manufacturers and suppliers also had a negative impact on stocks in the European automotive sector in the fourth quarter of 2018. This was exacerbated at the end of November by lower expectations for the development of production in the first half of 2019 and then in December by the significant tightening of the CO2 emission limits from 2025 and from 2030 by the European Commission. As a result, various manufacturers announced that they would already be revising their investment plans for the coming decade. In the fourth quarter, the EURO STOXX Automobiles & Parts reported a decrease of 17.4%. Over 2018 as a whole, its price loss came to 28.8%.
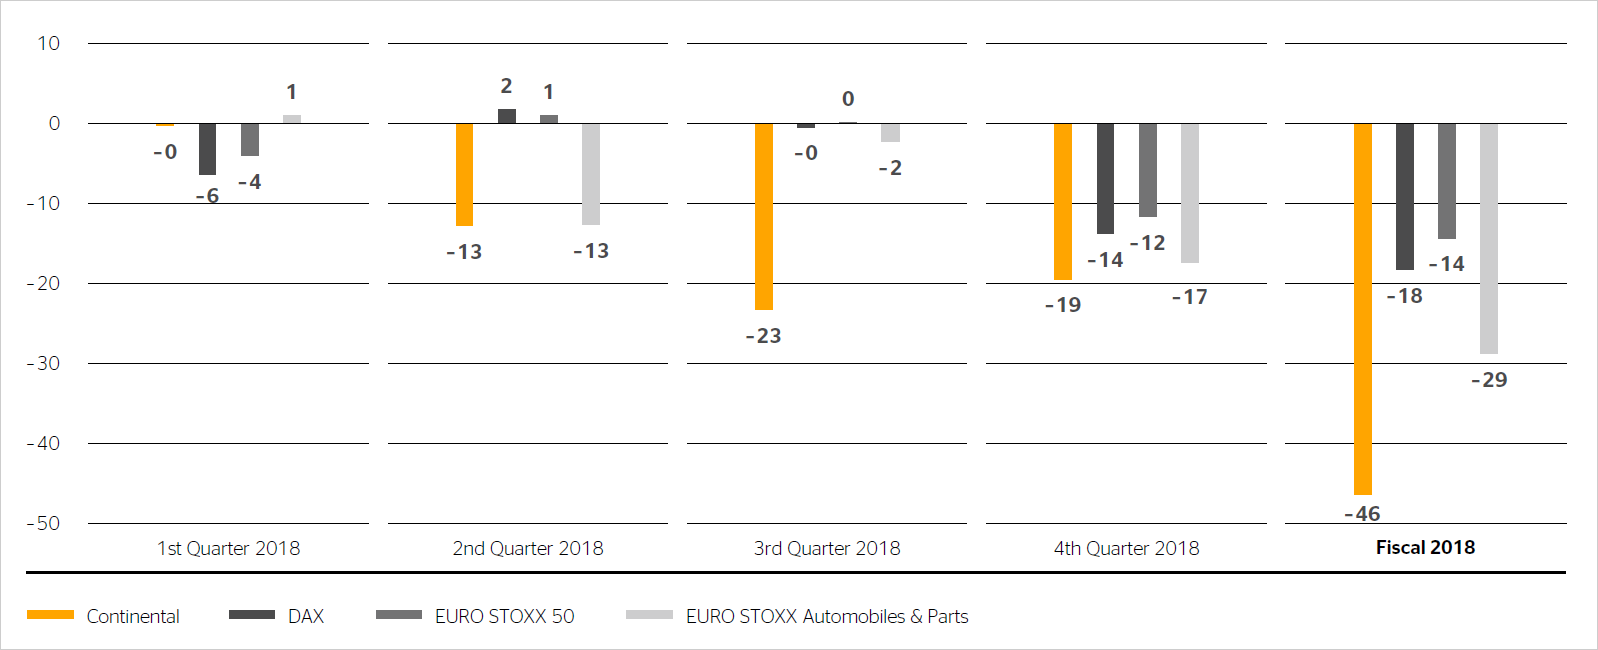
Price performance by quarter in 2018 (in %)
Significant decline in the price of Continental shares
In the first trading days of 2018, Continental shares rose from €225.05 at the end of 2017 to more than €230 as a result of several buy recommendations from analysts. During the course of January 9, 2018, media reports about a major reorganization of the Continental Corporation caused the Continental share price to soar to €257.40, a new all-time high. In February and March 2018, Continental shares performed largely in line with the automotive sector, closing the first quarter of 2018 at €224.30.
Continental shares mostly followed the trend in the European automotive sector in the second quarter of 2018 as well. The change of the 2018 outlook for the Continental Corporation on April 18, 2018, only temporarily impacted the price of Continental shares. They ended June 2018 at €195.55.
At the start of the third quarter of 2018, Continental shares benefited from the slight recovery of automotive stocks in Europe. Another change to the 2018 guidance for the Continental Corporation on August 22, 2018, however, caused the Continental share price to fall by 13.2%. The share price decreased further in the following weeks as a result of weaker market data, particularly from China, and further profit warnings from the sector. At the end of September, it was at €149.95. This corresponded to a decline of 23.3% in the third quarter of 2018.
| Outstanding bonds as at December 31, 2018 | ||||||
|---|---|---|---|---|---|---|
| WKN/ISIN | Coupon | Maturity | Volume in € millions | Issue price | Price as at Dec. 31, 2018 | Price as at Dec. 31, 2017 |
| A1Z7C3 / DE000A1Z7C39 | 0.500% | February 19, 2019 | 500.0 | 99.739% | 100.070% | 100.776% |
| A2DARM / XS1529561182 | 0.000% | February 5, 2020 | 600.0 | 99.410% | 100.041% | 100.227% |
| A1X3B7 / XS0969344083 | 3.125% | September 9, 2020 | 750.0 | 99.228% | 104.985% | 108.272% |
In the fourth quarter of 2018, Continental shares were negatively impacted by weak market data, further profit warnings from the sector, and concerns about production volumes in 2019. They ended the reporting year down 46.3% at €120.75.
In terms of its share-price performance, Continental was at the bottom end in the annual ranking of the 30 DAX shares in 2018, taking 28th place (PY: 10th place). Allowing for an immediate reinvestment of the dividend distribution of €4.50, Continental shares generated a total return of -45.2% in 2018. In 2018, the DAX achieved a return of -18.3%, the EURO STOXX 50 of -11.4% and the EURO STOXX Automobiles & Parts of -26.5% (including reinvested dividends in each case).
Continental bonds continue at low yield level
As in the previous year, Continental bonds persisted at a low yield level in 2018. The fluctuations on the bond markets and the slight rise in interest rates for corporate bonds in Europe over the course of the year had only a marginal impact on the prices of Continental bonds. The 3.125% euro bond maturing on September 9, 2020, was down by 328.7 basis points due to the reduction in its remaining maturity.
3.0% euro bond redeemed on July 16, 2018
The price of the 3.0% euro bond of Continental AG, which matured on July 16, 2018, continued to fall toward the 100% mark over its remaining term. The nominal value of €750.0 million was repaid on the maturity date.
Earnings per share reach their second-highest level
In the year under review, the net income attributable to the shareholders of the parent fell by 2.9% to €2.90 billion (PY: €2.98 billion). The reason for this was the Continental Corporation’s weaker operating performance. However, a lower tax rate meant that this decrease was less significant than the decline in the operating result. Earnings per share fell by 2.9% to €14.49 (PY: €14.92) and thus represented Continental AG’s second-highest earnings per share to date after the previous year’s record-breaking figure.
Dividend proposal of €4.75 per share
Despite the weaker operating performance, the Executive Board and the Supervisory Board have resolved to propose a dividend distribution of €4.75 per share for the past fiscal year to the Annual Shareholders’ Meeting to be held in Hanover on April 26, 2019. This proposal corresponds to €950.0 million or a dividend payout ratio of 32.8% of net income attributable to the shareholders of the parent. Based on the dividend proposal and the annual average Continental share price, this results in a dividend yield of 2.5% for 2018.
A dividend of €4.50 per share was paid for fiscal 2017, amounting to a total payout of €900.0 million. The dividend payout ratio was 30.2%, and the dividend yield was 2.2%.
Free float unchanged at 54.0%
As in the previous year, free float as defined by Deutsche Börse AG amounted to 54.0% as at the end of 2018. The most recent change took place on September 17, 2013, when our major shareholder, the IHO Group, Herzogenaurach, Germany, announced the sale of 7.8 million Continental shares, reducing the shareholding in Continental AG from 49.9% to 46.0%.
As at the end of 2018, the market capitalization of Continental AG amounted to €24.2 billion (PY: €45.0 billion). Market capitalization on the basis of free float in accordance with Deutsche Börse AG averaged €13.6 billion over the last 20 trading days of 2018 (PY: €24.3 billion). The trading volume, which is also relevant to index selection, amounted to €28.9 billion from January to December 2018 (PY: €19.9 billion). As at the end of 2018, Continental shares were ranked 24th (PY: 17th) in terms of free-float market capitalization and 16th (PY: 20th) in terms of stock exchange turnover among the 30 DAX shares in Deutsche Börse AG’s index ranking.
Increased share of free float in the U.S.A.
As at the end of the year, we determined the distribution of free float of Continental shares by way of shareholder identification (SID). We were able to assign 93.4 million of the 108.0 million shares held in the form of shares or alternatively as American depositary receipts (ADRs) in the U.S.A. to institutional and private investors. The identification ratio was 86.5% (PY: 84.7%).
A total of 85.6 million shares were attributable to more than 600 institutional investors in 43 countries. Private shareholders in Germany, other European countries and the U.S.A. held an estimated 7.8 million shares as at the end of the year.
According to the SID, the identified level of Continental shares held in Europe remained roughly the same as in the previous year at 56.8% (PY: 57.7%). The identified level of shares held by institutional investors from the United Kingdom and Ireland increased to 25.3% (PY: 24.3%). The identified holdings of German institutional investors dropped to 10.0% in the year under review (PY: 13.1%). At 5.7%, shareholdings of private German shareholders were slightly lower than the previous year’s level of 6.3%. Shareholdings of French institutional investors decreased slightly to 5.9% (PY: 6.0%). Scandinavian investors held 3.2% (PY: 3.0%) of Continental shares at the end of 2018. Shareholdings in other European countries climbed to 6.7% (PY: 5.0%).
| Continental share data | |
|---|---|
| Type of share | No-par-value share |
| German stock exchanges (regulated market) | Frankfurt (Prime Standard), Hamburg, Hanover, Stuttgart |
| German securities code number (WKN) | 543900 |
| ISIN | DE0005439004 |
| Reuters ticker symbol | CONG |
| Bloomberg ticker symbol | CON |
| Index memberships (selection) | DAX Prime All Share Prime Automobile NISAX |
| Outstanding shares as December 31, 2018 | 200,005,983 |
| Free float as at December 31, 2018 | |
| Continental’s American depositary receipt (ADR) data | |
|---|---|
| Ratio | 1 share : 10 ADRs |
| SEDOL number | 2219677 |
| ISIN | US2107712000 |
| Reuters ticker symbol | CTTAY.PK |
| Bloomberg ticker symbol | CTTAY |
| ADR Level | Level 1 |
| Trading | OTC |
| Sponsor | Deutsche Bank Trust Company Americas |
| ADRs issued as at December 31, 2018 | 7,201,770 (with 720,177 Continental shares deposited) |
As at the end of December 2018, institutional and private investors in the U.S.A. and Canada held a total of 26.3% (PY: 23.9%) of the free float in the form of shares or ADRs.
The identified shareholdings of institutional investors in Asia, Australia and Africa came to 3.5% at the end of the 2018 (PY: 3.1%).
Share capital unchanged
As at the end of 2018, the share capital of Continental AG still amounted to €512,015,316.48. It is divided into 200,005,983 no-par-value shares with a notional value of €2.56 per share. Each share has the same dividend entitlement.
In line with Article 20 of Continental AG’s Articles of Incorporation, each share grants one vote at the Shareholders’ Meeting. The current Articles of Incorporation are available on our website at www.continental-corporation.com under Company/Corporate Governance.
Continental share listings
Continental’s shares continue to be officially listed on the German stock exchanges in Frankfurt, Hamburg, Hanover and Stuttgart on the regulated market. They are also traded on other unofficial stock exchanges in Germany and Europe.
Continental ADR listings
In addition to being listed on European stock exchanges, Continental shares are traded in the U.S.A. as part of a sponsored ADR program on the over-the-counter (OTC) market. They are not admitted to the U.S. stock market. Since the split of the outstanding ADRs at the end of October 2018, ten ADRs (rather than the previous five) are equivalent to one Continental share.
Continental Investor Relations online
For more information about Continental shares, bonds and credit ratings, please visit www.continental-ir.de. In addition, updates are also available on Twitter at @Continental_IR.
| Key figures of the Continental share1 | ||
|---|---|---|
| € (unless otherwise specified) | 2018 | 2017 |
| Basic earnings per share | 14.49 | 14.92 |
| Diluted earnings per share | 14.49 | 14.92 |
| Dividend per share | 4.752 | 4.50 |
| Dividend payout ratio (%) | 32.82 | 30.2 |
| Dividend yield (%) | 2.52 | 2.2 |
| Annual average price-earnings ratio (P/E ratio)3 | 13.2 | 13.5 |
| Share price at year end | 120.75 | 225.05 |
| Annual average share price | 191.27 | 201.45 |
| Share price at year high | 257.40 | 228.85 |
| Share price at year low | 119.10 | 180.70 |
| Number of outstanding shares, average (in millions) | 200.0 | 200.0 |
| Number of outstanding shares as at December 31 (in millions) | 200.0 | 200.0 |
1 All market prices are quotations of the Continental share in the Xetra system of Deutsche Börse AG.
2 Subject to the approval of the Annual Shareholders’ Meeting on April 26, 2019.
3 Net income attributable to the shareholders of the parent per share at the annual average share price.