

22.5% increase in the Continental share price.
Largely positive trend on stock markets
In the first weeks of 2017, the leading stock markets in Europe, the U.S.A. and Asia initially trended sideways on the whole, due to the lack of clear stimuli. Sentiment on the U.S. stock markets improved from the end of January, with the new U.S. government promising extensive tax cuts, deregulation, and infrastructure measures. Prices also rose on the European stock markets in February. The increase was more modest, however, as it was curbed by concerns about the U.S.A.’s barriers to trade and the outcome of the upcoming Dutch election in March 2017, which was uncertain at the time. In Europe and in the U.S.A., support came from company results that were largely better than expected. Positive economic data from Germany and the eurozone caused European stocks to rise further at the end of March.
In the first weeks of the second quarter, the U.S. Federal Reserve (Fed) surprised investors with indications of a potentially more rapid normalization of its monetary policy. In addition, political tensions between the U.S.A. and North Korea as well as the conflict in Syria created uncertainty, resulting in declining prices on global stock markets. Furthermore, many shareholders were waiting for the outcome of the first round of the French presidential election on April 23, 2017. The result led to an increase in confidence and rising prices on European and many international stock markets. In mid-May, doubts about the feasibility of the fiscal and tax-policy measures announced by the U.S. government led to profit taking on stock markets around the world. However, share prices stabilized again in the following weeks as a result of positive economic data. The DAX also rose again in June, marking a new all-time high at 12,951.54 points on the morning of June 20, 2017. Over the course of the day, however, a considerable decline in the price of crude oil and the start of negotiations for the United Kingdom’s exit from the European Union prompted further profit taking. In June, changes in the forecasts of individual automotive and chemical companies also resulted in further price decreases, especially on European stock markets.
The appreciation of the euro that began after the French presidential election in the second quarter continued in the third quarter of 2017. This particularly affected export-oriented shares on the stock exchanges of the eurozone. In contrast, the weaker U.S. dollar together with good corporate and economic data boosted prices on U.S. stock markets. In August, the further rise in tension between the U.S.A. and North Korea as well as fears that the situation would escalate led to declining prices on stock exchanges worldwide. The DAX temporarily fell below 11,900 points, but stabilized above the 12,000 point mark at the end of August. In September, signs that tensions were easing with North Korea triggered a change of mood on the stock markets and caused prices to rise again. On the stock exchanges of the eurozone, this also boosted the performance of the euro, which weakened against the U.S. dollar once again. This was due primarily to the prospect of long coalition negotiations following the federal election in Germany, the political tensions between Catalonia and the Spanish government, and the Fed’s announcement that it would again reduce its total assets, which had been bloated by bond purchases, starting from October 2017.
The good sentiment on the stock markets continued initially in the fourth quarter of 2017. In the U.S.A., it became increasingly likely during the course of the quarter that both the House of Representatives and the Senate would approve the U.S. government’s tax reform. U.S. stock markets were boosted by the planned cut in corporate taxes this reform would bring about. Furthermore, the U.S. dollar was down against the euro again in November and December. The Dow Jones broke one record after another, ending the year at 24,719.22 points after the U.S. tax reform was passed just before Christmas. With an increase of nearly 5,000 points, it was up 25.1% in 2017. In Europe, however, the appreciation of the euro from November slowed down the stock markets and resulted in profit taking. The DAX, which had reached a new all-time high of 13,525.56 points at the beginning of November, closed the year at 12,917.64 points – a rise of 12.5% for the year as a whole. The EURO STOXX 50 ended the year at 3,503.96, having grown by 6.5%.
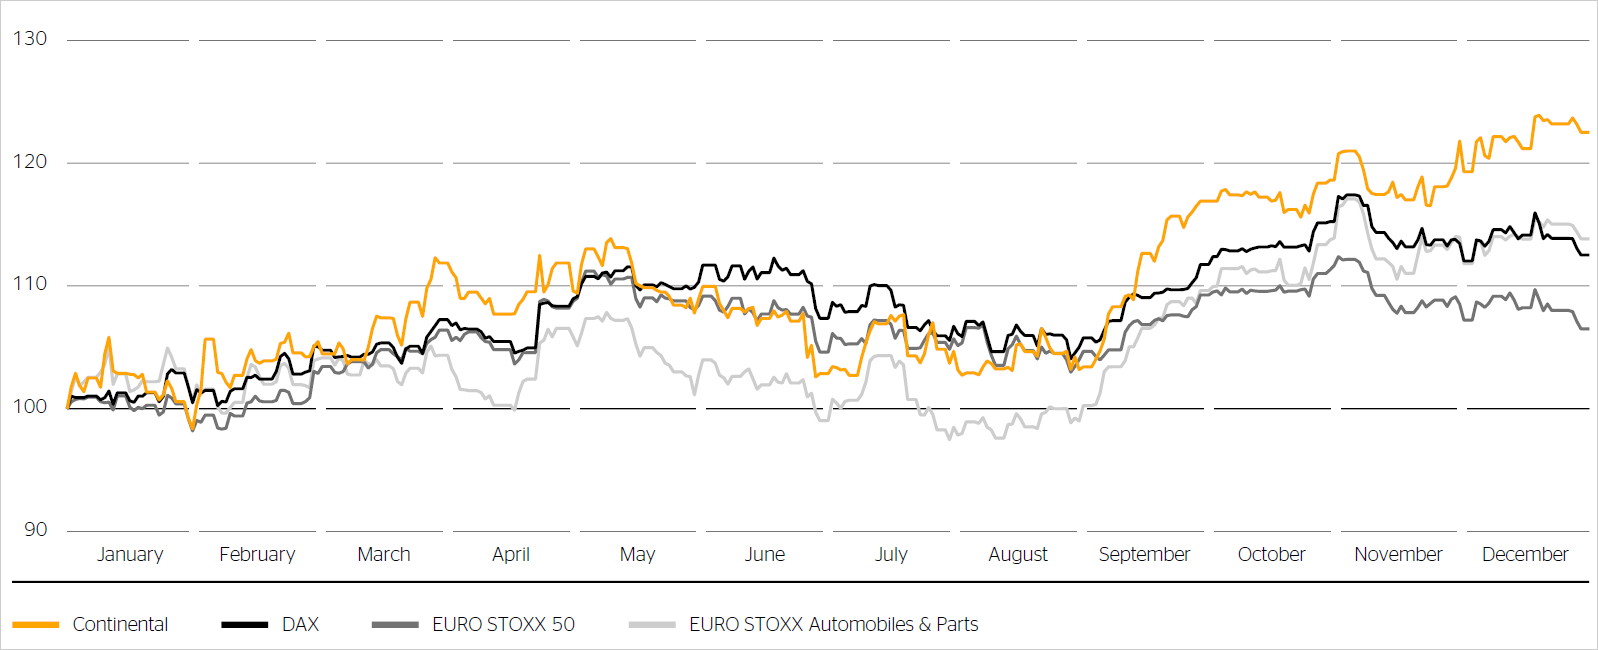
Price performance of Continental shares in 2017 versus selected stock indexes
(indexed to January 1, 2017)
Surge in the automotive sector from September 2017
European automotive and supplier stocks benefited from positive passenger-car registration data in Western Europe in the first quarter of 2017. The concerns of many shareholders about the U.S.A.’s potential barriers to trade, however, had a negative impact on export-oriented European automotive stocks over the rest of the quarter.
In the second quarter, declining sales figures for passenger cars, especially in the U.S.A., and rising inventories in China resulted in growing investor uncertainty about the expected development of passenger-car sales volumes and production. As a result, European automotive stocks performed worse than the market overall during the course of the quarter. In June, reductions in the forecasts for the current year by various suppliers and more cautious estimates of new car sales figures for the current year by a U.S. manufacturer caused further price declines.
In the third quarter, the European automotive sector initially developed in line with the whole market. In September, the prices of European automotive and supplier stocks surged due to the general change in mood on the markets as well as several analysts’ positive reassessment of the sector and the reporting on the International Motor Show in Frankfurt, Germany.
In line with the market as a whole, the positive trend persisted until early November before the appreciation of the euro also impacted the shares of listed European automotive and supplier companies. Positive passenger-car registration data for Western and Eastern Europe provided support in October and November, resulting in the sector outperforming the market as a whole. The EURO STOXX Automobiles & Parts rose by 13.8% in 2017 as a whole.
Continental shares outperform markets significantly
In mid-January 2017, Continental shares benefited from the announcement of the preliminary figures for the 2016 fiscal year and the publication of the complete business figures in early March. Several upgrades and price-target increases by various analysts also had a positive effect on the share price in early February and the second half of March. Continental shares exceeded the €200 mark in the last week of March.
In April 2017, Continental shares initially dropped in line with the general market trend. The publication of the figures for the first quarter of 2017, the increase in the sales forecast for the current year, and repeated upgrades and price-target increases by various analysts caused Continental shares to climb again. In the second half of the quarter, the share price initially fell to around the €200 mark, before sinking further at the end of the quarter due to negative news from the automotive sector.
In the third quarter, Continental shares initially ranged between €188 and €200. In September, investors’ growing interest in the sector caused the shares to increase to €214.75 at the end of the quarter.
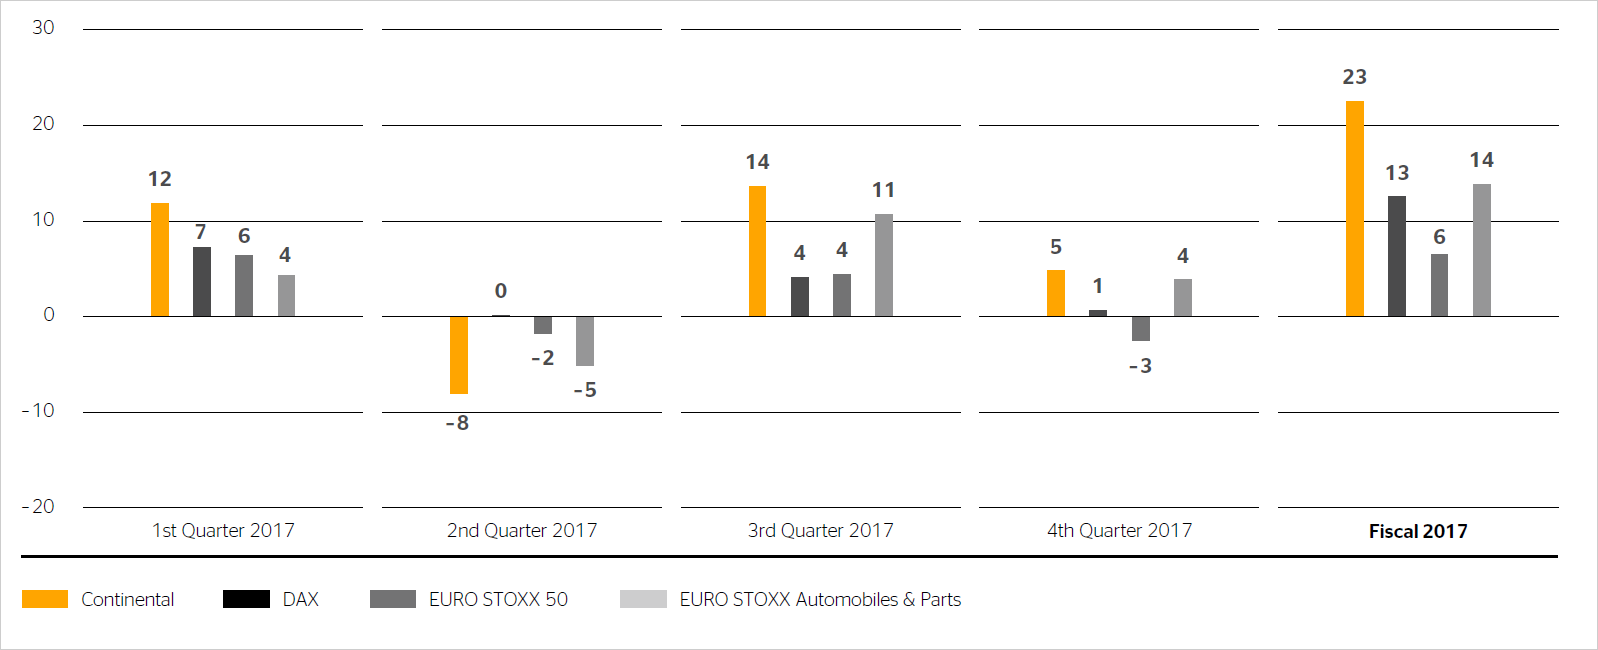
Price performance by quarter in 2017 (in %)
In line with the market as a whole, the price continued to rise until early November before the general market performance again resulted in falling prices. The publication of the figures for the third quarter of 2017 and the positive outlook for the fourth quarter stabilized Continental shares at around €215 in the middle of November. In the following weeks, the shares benefited not only from the performance of the sector but also again from buy recommendations and price-target increases by several analysts.
At the end of 2017, Continental shares were quoted at €225.05, a 22.5% increase on their price of €183.70 at the end of 2016. In terms of this share-price performance, Continental was at the top end in the annual ranking of the 30 DAX shares in 2017, taking 10th place (PY: 27th place).
| Performance of Continental shares over various time periods versus selected stock indexes | ||||
|---|---|---|---|---|
| Investment period for €10,000 | Continental1 | DAX | EURO STOXX 50 1 | EURO STOXX Automobiles & Parts1 |
| 1 year (Jan. 1, 2017 – Dec. 31, 2017) | €12,504 | €11,251 | €10,986 | €11,735 |
| Yield in % p.a. | 25.0 | 12.5 | 9.9 | 17.3 |
| 3 years (Jan. 1, 2015 – Dec. 31, 2017) | €13,547 | €13,174 | €12,331 | €13,490 |
| Yield in % p.a. | 10.6 | 9.6 | 7.2 | 10.5 |
| 5 years (Jan. 1, 2013 – Dec. 31, 2017) | €28,196 | €16,969 | €15,817 | €20,334 |
| Yield in % p.a. | 23.0 | 11.1 | 9.6 | 15.2 |
| 10 years (Jan. 1, 2008 – Dec. 31, 2017) | €30,024 | €16,012 | €11,817 | €21,776 |
| Yield in % p.a. | 11.6 | 4.8 | 1.7 | 8.1 |
1 Including reinvested dividends.
Continental shares outperform markets over various time periods
Allowing for an immediate reinvestment of the dividend distribution of €4.25, Continental shares generated a return of 25.0% in 2017, outperforming their benchmark indexes significantly. In 2017, the DAX saw a return of 12.5%, the EURO STOXX 50 9.9%, and the EURO STOXX Automobiles & Parts 17.3% (including reinvested dividends in each case).
Continental shares also performed better when compared over longer periods:
- Investing €10,000 in Continental shares at the beginning of 2015 would have generated a yield of 10.6% per year or an increase in value of 35% to €13,547 over the past three years. Among the benchmark indexes, only EURO STOXX Automobiles & Parts generated a similar yield of 10.5% per year.
- Over the past five years, the same investment would have generated an increase in value of 182% to €28,196 (23.0% p.a.). In this case, a considerably higher yield would have been generated than with an investment in the benchmark indexes.
- A comparison of the performance over the past ten years also shows a substantial increase in value of 200% to €30,024 for a €10,000 investment in Continental shares. With an annual yield of 11.6%, Continental shares outperformed the comparative indexes over this ten-year period as well.
Continental euro bonds at low yield level
As in the previous year, Continental euro bonds persisted at a low yield level during 2017. This was due to continuing low interest rates and the sound capital base of Continental.
In 2017, the price of the 3.0% euro bond maturing on July 16, 2018, declined by 293.4 basis points to 101.769% as a result of the reduction in the remaining maturity.
At the end of December 2017, the 0.5% euro bond maturing on February 19, 2019, was quoted at 100.776%, down 30.5 basis points compared to the end of 2016.
The price of the 0.0% euro bond, which was issued in the fourth quarter of 2016 and matures on February 5, 2020, remained at around the 100% mark in 2017. At the end of 2017, it was quoted at 100.227%, up 48.0 basis points compared to the end of 2016.
The price of the 3.125% euro bond maturing on September 9, 2020, fell by 275.2 basis points in the reporting period due mainly to the reduction in the remaining maturity. At the end of 2017, the bond was quoting at 108.272%.
| Outstanding bonds as at December 31, 2017 | ||||||
|---|---|---|---|---|---|---|
| WKN/ISIN | Coupon | Maturity | Volume in € millions | Issue price | Price as at Dec. 31, 2017 | Price as at Dec. 31, 2016 |
| A1X24V / XS0953199634 | July 16, 2018 | 750.0 | ||||
| A1Z7C3 / DE000A1Z7C39 | February 19, 2019 | 500.0 | ||||
| A2DARM / XS1529561182 | February 5, 2020 | 600.0 | ||||
| A1X3B7 / XS0969344083 | September 9, 2020 | 750.0 | ||||
2.5% euro bond redeemed on March 20, 2017
During the first quarter of 2017, the price of the 2.5% euro bond of Conti-Gummi Finance B.V., Maastricht, Netherlands, which matured on March 20, 2017, continued to fall toward the 100% mark. The nominal value of €750.0 million was repaid on the maturity date.
Five-year CDS premium ends 2017 at 11-year low
The premiums for insuring against credit risks (credit default swap, CDS) initially remained largely unchanged at a relatively low level in the reporting period. This was due to the comparatively quiet stockmarket environment in the first quarter of 2017, the generally positive profit development of many companies, and the continually low interest rates in the eurozone in particular, which was thanks to the European Central Bank’s (ECB) unchanged expansionary monetary policy. The growing confidence for the further development of the eurozone after the result of the first round of voting in the French presidential election also led to falling CDS premiums for euro corporate bonds after April 23, 2017.
In the first quarter of 2017, the five-year CDS premium for Continental still remained within a small range of 50 to 60 basis points. During the second and third quarter, it fell temporarily below 40 basis points. In the fourth quarter, it declined broadly in line with its reference index, the Markit iTraxx Europe, to 30.224 basis points, marking a new 11-year low. At the end of 2017, it was at 32.563 basis points, 26.518 down on the 59.081 basis points at the end of the previous year. The spread in relation to its reference index amounted to -12.213 basis points at the end of the year (December 31, 2016: -13.234 basis points).
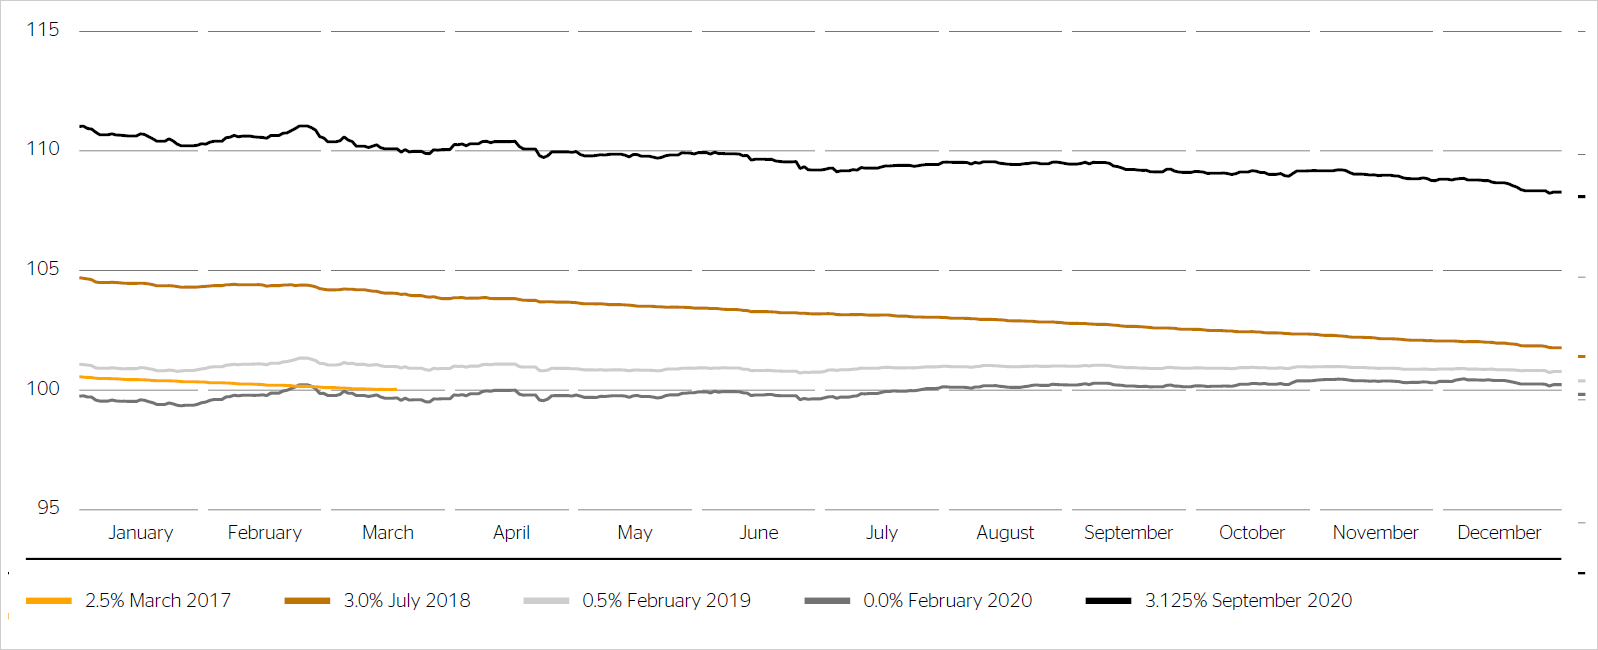
Price performance of Continental bonds in 2017
The three major rating agencies each maintained their credit ratings for Continental AG during 2017.
| Rating | ||
|---|---|---|
| December 31, 2017 | Rating | Outlook |
| Standard & Poor’s1 | BBB+ | stable |
| Fitch2 | BBB+ | stable |
| Moody’s3 | Baa1 | stable |
| December 31, 2016 | Rating | Outlook |
| Standard & Poor’s1 | BBB+ | stable |
| Fitch2 | BBB+ | stable |
| Moody’s3 | Baa1 | stable |
1 Contracted rating since May 19, 2000.
2 Contracted rating since November 7, 2013.
3 Non-contracted rating since February 1, 2014.
Net income per share reaches another all-time high
In the year under review, the net income attributable to the shareholders of the parent rose by 6.5% to a new high of €2.98 billion after €2.80 billion in the previous year. The reason for this was the Continental Corporation’s good operating performance overall.
Earnings per share, i.e. the portion of profits attributable to the shareholders per share, are calculated by dividing the net income attributable to the shareholders of Continental AG by the average number of shares outstanding. This figure rose accordingly by 6.5% to €14.92 (PY: €14.01) – also a new high.
Dividend proposal increased to €4.50 per share
The Executive Board and the Supervisory Board have resolved to propose a 5.9% increase in the dividend distribution to €4.50 per share for the past fiscal year to the Annual Shareholders’ Meeting to be held in Hanover on April 27, 2018. This would make it the sixth dividend increase in a row since the dividend payout of €1.50 for fiscal 2011. This proposal corresponds to €900.0 million or a dividend payout ratio of 30.2% of net income attributable to the shareholders of the parent. Based on the dividend proposal and the annual average Continental share price, this results in a dividend yield of 2.2% for 2017.
A dividend of €4.25 per share was paid for fiscal 2016, amounting to a total payout of €850.0 million. The dividend payout ratio was 30.3%, and the dividend yield was 2.3%.
Free float unchanged at 54.0%
As in the previous year, free float as defined by Deutsche Börse AG amounted to 54.0% as at the end of 2017. The most recent change took place on September 17, 2013, when our major shareholder, the IHO Group, Herzogenaurach, Germany, announced the sale of 7.8 million Continental shares, reducing its shareholding in Continental AG from 49.9% to 46.0%.
As at the end of 2017, the market capitalization of Continental AG amounted to €45.0 billion (PY: €36.7 billion). Market capitalization on the basis of free float in accordance with Deutsche Börse AG averaged €24.3 billion over the last 20 trading days of 2017 (PY: €19.6 billion). The trading volume in euros, which is also relevant to index selection, amounted to €19.9 billion from January to December 2017 (PY: €20.5 billion).
As at the end of 2017, Continental shares were ranked 17th (PY: 16th) in terms of free-float market capitalization and 20th (PY: 16th) in terms of stock exchange turnover among the 30 DAX shares in Deutsche Börse AG’s index ranking.
Increased share of free float in the U.S.A.
As at the end of the year, we once again determined the distribution of free float of Continental shares by way of shareholder identification (SID). We were able to assign 91.5 million of the 108.0 million shares held in the form of shares or alternatively as American depository receipts (ADRs) in the U.S.A. to institutional and private investors. The identification ratio was 84.7% of free float (PY: 84.3%).
A total of 81.8 million shares were attributable to more than 550 institutional investors in 37 countries. Private shareholders in Germany, other European countries and the U.S.A. held 9.3 million shares as at the end of the year.
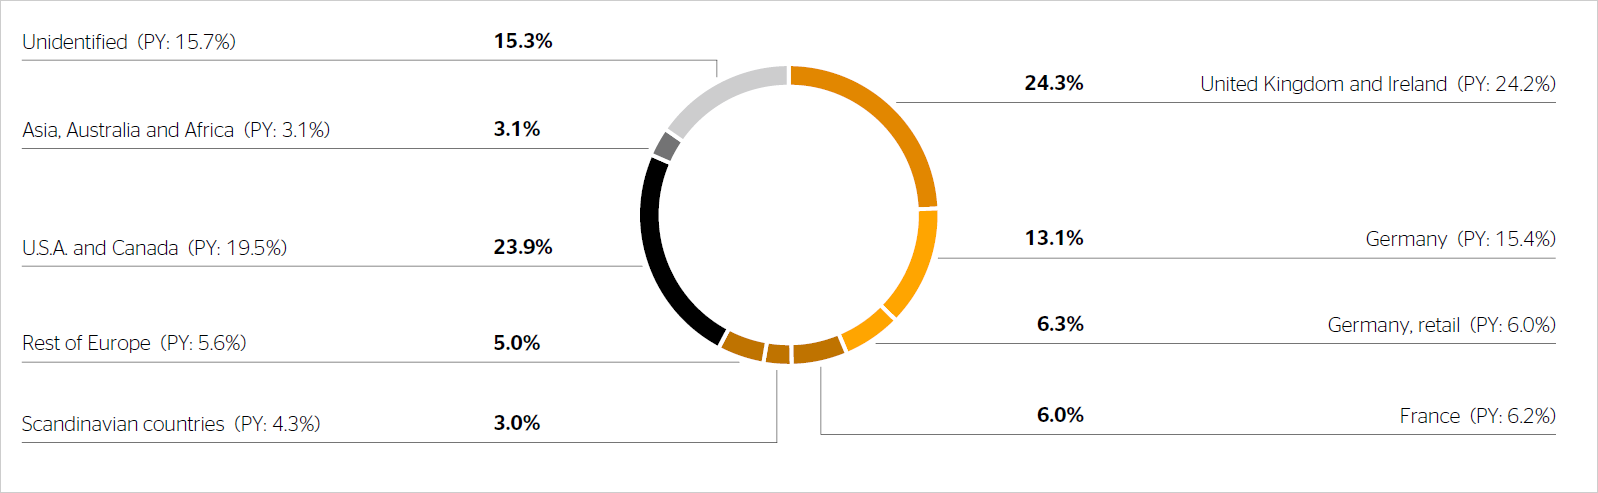
Geographic distribution of free float in 2017
According to the SID, the identified level of Continental shares held in Europe declined to 57.7% (PY: 61.7%). The identified level of shares held by institutional investors from the United Kingdom and Ireland at 24.3% (PY: 24.2%) remained nearly unchanged. The identified holdings of German institutional investors dropped to 13.1% in the year under review (PY: 15.4%). At 6.3%, shareholdings of private German shareholders were slightly higher than in the previous year at 6.0%. In the year under review, the level of shares held by French institutional investors remained relatively stable at 6.0%, almost at the same level of the previous year at 6.2%. Scandinavian investors held about 3.0% (PY: 4.3%) of Continental shares at the end of 2017. Shareholdings of 5.0% (PY: 5.6%) were identified in other European countries.
As at the end of December 2017, institutional and private investors in the U.S.A. and Canada held a total of 23.9% (PY: 19.5%) of the free float in the form of shares or ADRs. At the end of the reporting year, identified level of shares held by institutional investors were down in Canada, but in the U.S.A. they were up substantially.
As in the previous year, the identified shareholdings of institutional investors in Asia, Australia and Africa were 3.1% at the end of the 2017.
| Continental share data | |
|---|---|
| Type of share | No-par-value share |
| German stock exchanges (regulated market) | Frankfurt (Prime Standard), Hamburg, Hanover, Stuttgart |
| German securities code number (WKN) | 543900 |
| ISIN | DE0005439004 |
| Reuters ticker symbol | CONG |
| Bloomberg ticker symbol | CON |
| Index memberships (selection) | DAX Prime All Share Prime Automobile NISAX |
| Outstanding shares as December 31, 2017 | 200,005,983 |
| Free float as at December 31, 2017 | |
| Continental’s American depositary receipt (ADR) data | |
|---|---|
| Ratio | 1 share : 5 ADRs |
| SEDOL number | 2219677 |
| ISIN | US2107712000 |
| Reuters ticker symbol | CTTAY.PK |
| Bloomberg ticker symbol | CTTAY |
| ADR Level | Level 1 |
| Trading | OTC |
| Sponsor | Deutsche Bank Trust Company Americas |
| ADRs issued as at December 31, 2017 | 8,086,275 (with 1,617,255 Continental shares deposited) |
Share capital unchanged
As at the end of 2017, the share capital of Continental AG still amounted to €512,015,316.48. It is divided into 200,005,983 no-par-value shares with a notional value of €2.56 per share. Each share has the same dividend entitlement.
In line with Article 20 of Continental AG’s Articles of Incorporation, each share grants one vote at the Shareholders’ Meeting. The current Articles of Incorporation are available on our website at www.continental-corporation.com under Company/Corporate Governance.
Continental share listings
Continental’s shares continue to be officially listed on the German stock exchanges in Frankfurt, Hamburg, Hanover and Stuttgart on the regulated market. Continental’s shares are also traded on other unofficial stock exchanges in Germany and Europe.
Continental ADR listings
In addition to being listed on European stock exchanges, Continental shares are traded in the U.S.A. as part of a sponsored ADR program on the over-the-counter (OTC) market. They are not admitted to the U.S. stock market. Since the split of the outstanding ADRs on December 23, 2013, in a ratio of 1:5, five Continental ADRs are equivalent to one Continental share.
Continental Investor Relations online
For more information about Continental shares, bonds and credit ratings, as well as our Investor Relations app, please visit www.continental-ir.de.
In addition, updates about Continental are also available on Twitter at @Continental_IR.
| Key figures of the Continental share1 | ||
|---|---|---|
| € (unless otherwise specified) | 2017 | 2016 |
| Basic earnings per share | 14.92 | 14.01 |
| Diluted earnings per share | 14.92 | 14.01 |
| Free cash flow per
|
8.76 | 8.86 |
| Dividend per share | 4.502 | 4.25 |
| Dividend payout ratio (%) | 30.22 | 30.3 |
| Dividend yield (%) | 2.22 | 2.3 |
| Total equity (book value) per share as at December 313 | 79.14 | 71.35 |
| Yearly average price-earnings ratio (P/E ratio)4 | 13.5 | 13.2 |
| Share price at year end | 225.05 | 183.70 |
| Annual average share price | 201.45 | 185.26 |
| Share price at year high | 228.85 | 220.10 |
| Share price at year low | 180.70 | 158.20 |
| Average XETRA trading volume per trading day (units) | 392,132 | 436,412 |
| Number of outstanding shares, average (in millions) | 200.0 | 200.0 |
| Number of outstanding shares as at December 31 (in millions) | 200.0 | 200.0 |
1 All market prices are quotations of the Continental share in the XETRA system of Deutsche Börse AG.
2 Subject to the approval of the Annual Shareholders’ Meeting on April 27, 2018.
3 Equity attributable to the shareholders of the parent per share.
4 Net income attributable to the shareholders of the parent per share at the annual average share price.