Sustainability Report – Environmental Information
Climate Change (ESRS E1)
Material Impacts, Risks and Opportunities Related to Climate Change
Continental assessed its actual and potential negative and positive impacts as well as abstract and tangible risks and opportunities related to climate change according to the regulatory requirements, as described in the General Disclosures (ESRS 2) section. The general disclosures include an overview of the assessment of all identified impacts, risks and opportunities (IROs), including the time horizons considered.
In this IRO assessment, the material impacts, risks and opportunities related to climate change were identified. For easier understanding and reading, they have been grouped together into the following IRO clusters:
- Scope 1 and Scope 2 emissions
- Scope 3 emissions, value chain resilience and transition
- Climate change adaptation
Compared with the previous year, the IRO cluster Scope 3 emissions, value chain resilience and transition now also includes IROs related to supply chain resilience and transition.
The descriptions of potential negative impacts and abstract risks are presented from a business-inherent perspective. They outline general impact potentials and risk exposures based on structural aspects such as business activity, geographical aspects, business model and product characteristics. This does not take into account mitigation through the management approach of Continental described in the respective IRO cluster. Actual negative impacts, tangible risks, positive impacts and opportunities are described from a company-specific perspective and consider the outcomes of the management approaches. A detailed definition of the IRO types can be found in the Impact materiality and Financial materiality subsections in the General Disclosures (ESRS 2) section.
The descriptions of IROs are to be considered as self-contained, which may result in repetitions.
The following pages provide detailed descriptions of the IROs within the respective IRO cluster. They also outline the management approach developed for each IRO cluster, which manages the identified impacts, risks and opportunities. In addition, the associated targets, actions and metrics are explained (where available).
Risks 11, 12 and 13 represent climate-related physical risks. The remaining identified risks are transition risks.
Management Approaches for Climate Change Mitigation, Climate Change Adaptation, Energy Efficiency and Renewable Energy
Regarding climate change, Continental has implemented management approaches that include the following IRO clusters:
- Scope 1 and Scope 2 emissions;
- Scope 3 emissions, value chain resilience and transition;
- Climate change adaptation.
The following table illustrates the ESRS E1-2 topic areas that are addressed by these specific management approaches.
|
IRO cluster |
||
|
Scope 1 and |
Scope 3 emissions, value chain resilience and transition |
Climate change adaptation |
Climate change mitigation |
X |
X |
|
Climate change adaptation |
|
|
X |
Energy efficiency |
X |
X |
|
Use of renewable energies |
X |
X |
|
Continental has not implemented any further management approaches relating to other aspects of climate change. The following pages provide detailed descriptions of the IROs within the respective IRO cluster.
They also outline the management approach developed for each cluster, which manages the identified impacts, risks and opportunities. In addition, the associated targets, actions and metrics are explained (where available).
Scope 1 and Scope 2 Emissions
Material impacts, risks and opportunities in the Scope 1 and Scope 2 emissions IRO cluster
ID |
Short description |
Type of IRO |
Primary |
Explanation |
||||
1 |
Scope 1 and Scope 2: |
Potential |
Short-term |
Continental operates a wide range of industrial production processes, such as vulcanization, mixing and extrusion, which process and industry inherently involve high energy demands. Depending on the energy sources used, this can result in material potential negative impacts from greenhouse gas emissions generated by Continental’s own production processes. |
||||
2 |
Devaluation of assets due to climate change mitigation regulations (1.5°C scenario without overshoot) |
Abstract |
Medium-term |
Continental operates a wide range of industrial production processes across various locations and markets. This results in an inherent risk exposure to regulatory developments and market dynamics that may affect these locations directly or indirectly through the portfolio. In a scenario to be analyzed according to the ESRS – characterized by highly ambitious regulations allowing no or only limited overshoot of a 1.5°C temperature increase – the regulatorily required pace of decarbonization could significantly exceed the adaptation speed of industries in general as well as Continental’s locations. This could impair the value of the associated assets. |
||||
3 |
Higher operating costs/ |
Abstract |
Medium-term |
Continental operates a wide range of energy-intensive industrial production processes, such as vulcanization, mixing and extrusion. This results in an inherent risk exposure linked to the pace of transformation in response to climate change. In a scenario to be analyzed according to the ESRS – characterized by highly ambitious regulations allowing no or only limited overshoot of a 1.5°C temperature increase – regulatory requirements and market conditions could tighten significantly. This could lead to substantial increases in operating costs and additional investments to reduce process-related emissions. |
||||
Management approach for Scope 1 and Scope 2 emissions
Continental is convinced that mobility and the global economy must transition to carbon neutrality. We support the principles and goals of the Paris Agreement and, as part of our sustainability ambition, we are committed to continuously implementing measures to reduce greenhouse gas emissions in our own operations (Scope 1 and 2). To support this ambition, Continental has implemented a management approach that focuses on mitigating negative environmental impacts and risks in relation to Scope 1 and Scope 2 GHG emissions. The management approach also addresses the minimization of transition risks related to Scope 1 and Scope 2.
The management approach for Scope 1 and Scope 2 emissions covers the entire Continental Group and focuses especially on production sites, as they are particularly emission-intensive compared with other types of locations.
Responsibility for the operational implementation of the management approach to reduce greenhouse gas (GHG) emissions lies with the respective entities. Implementation is coordinated by the manufacturing and operations functions within the group sectors, which implement defined actions together with the respective entities. Monitoring takes place through a multi-level process involving environmental departments, the group sector boards and the Sustainability Steering Committee.
Continental has established multiple processes to continuously reduce Scope 1 and Scope 2 emissions and to create a framework for specific quantified targets and actions.
Continental pursues a GHG reduction target covering Scope 1 and market-based Scope 2 GHG emissions related to production in the tire business. Progress is monitored through regularly reported emission values (see the Targets related to Scope 1 and Scope 2 emissions subsection). The process includes dedicated GHG data analyses at various organizational levels and – where necessary – updates to the intended trajectories. Results are regularly presented to the Sustainability Steering Committee and within the group sectors. GHG emission data serves as the basis for reduction measures (see the Key actions for target achievement related to Scope 1 and Scope 2 emissions subsection), which provide a framework for implementing the necessary actions and are regularly updated based on actual emission values. Continuous calibration of the levers and location-specific actions required to pursue the trajectory is a key element of the reduction measures. Regular dialogue on best practices, for example by functions such as infrastructure and environment, supports the implementation of technical solutions and the corresponding program management within Continental’s group sectors.
The implementation of the target-related reduction plan is also supported by actions to optimize energy consumption and energy costs. This also includes the expansion of capacities for the in-house generation of electricity from renewable sources as a substitute for the external purchase of green electricity (see the Key actions for target achievement related to Scope 1 and Scope 2 emissions subsection). General increases in energy efficiency (e.g. through LED lighting, new machines or leak prevention) are part of the continuous improvement processes within the local environmental and energy management systems.
The identified abstract risk of a devaluation of own production facilities and real estate due to climate change mitigation regulations is however primarily dependent on the general transformation of the company’s business models and is therefore directly related to the management approach described for decarbonizing own business operations and industries as a whole.
The framework for the management approach for Scope 1 and Scope 2 emissions is set by internal climate change mitigation rules and the sustainability ambition. Investments are additionally subject to the Continental Group’s general investment rules.
As part of the management approach and local management systems, the standards ISO 14001 (environmental management systems) and ISO 50001 (energy management systems) are applied at locations where implemented actions require them. GHG emissions calculation and reporting follow the standards of the GHG Protocol. Furthermore, multiple climate change mitigation agreements, such as the Paris Agreement, as well as regulatory requirements, such as the EU Emissions Trading System, serve as references.
The management approach for Scope 1 and Scope 2 emissions considers the global interest of different stakeholders in climate change mitigation. The focus is on the expectations and requirements of investors and customers to make a positive contribution to climate change mitigation through their value chains.
The management approach is communicated internally through various formats and publications on the company-wide intranet. Externally, the management approach is communicated by means of sustainability reporting, press releases, dialogue with customers and investors, as well as trade fairs.
Targets related to Scope 1 and Scope 2 emissions
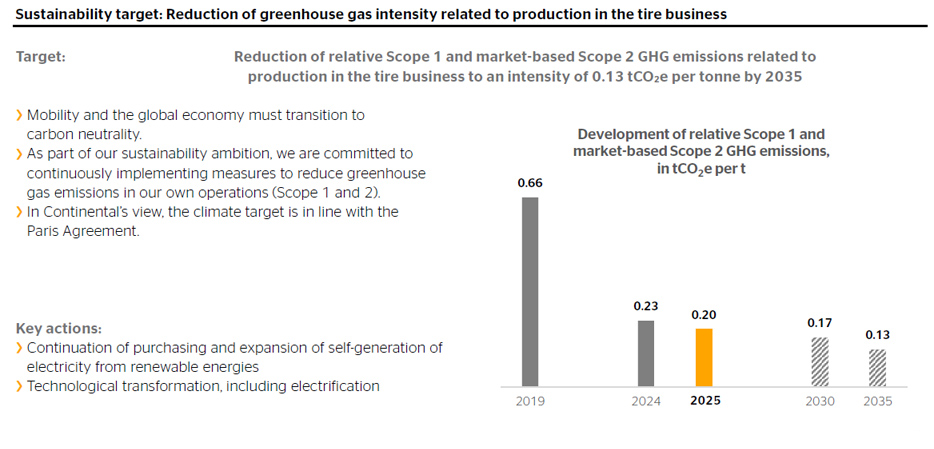
In line with its sustainability ambition, Continental has set a public sustainability target related to climate change that aims to reduce relative Scope 1 and market-based Scope 2 GHG emissions related to production in the tire business to an intensity of 0.13 tonnes of CO2 equivalent (tCO2e) per tonne of production by 2035.
The interim target for 2030 is to reduce Scope 1 and market-based Scope 2 GHG emissions to an intensity of 0.17 tCO2e per tonne of production.
In line with implemented and planned organizational changes, the public sustainability target reported in the previous year (absolute reduction to 0.5 million tCO2e by 2035) was adapted to the new structure in 2025 and converted into an intensity target for production in the tire business. Within the tire business, production accounts for the majority of emissions.
In the Tires group sector, the former corporate target had already been operationalized in previous years as an internal intensity-based target for production using the now-applied target values. This target is now also reported externally as a public sustainability target. Choosing an intensity target enables more effective internal management, increases resilience to changes in production volumes and plant structures, and provides investors and customers with more comparable information in competitive contexts. For these reasons, the previously reported public sustainability target for absolute reductions is being continued and reported as a public sustainability target for the intensity of the tire production.
A decision on further specific targets related to greenhouse gas emissions (e.g. for ContiTech’s industrial business) will be made by the respective organizations after the planned organizational changes have been implemented.
Both the main target and the interim target are intensity targets. Converted into absolute values, and based on the situation today without taking into account possible changes such as production volumes, this corresponds to a reduction to less than 0.3 million tonnes of CO2 equivalent (million tCO2e) by 2035 and less than 0.4 million tCO2e by 2030.
The formalized target commitment to reduce relative Scope 1 and market-based Scope 2 GHG emissions related to production is a key element of the corresponding management approach for Scope 1 and Scope 2 emissions and the subsequent key actions. The transition to and ultimate achievement of the target allow Continental to mitigate negative impacts and risks associated with Scope 1 and Scope 2 GHG emissions.
The target covers combined Scope 1 and market-based Scope 2 GHG emissions. The target value was defined in alignment with the guidance of the GHG Protocol on calculating Scope 1 and market-based Scope 2 GHG emissions and includes the greenhouse gases described in the metric “Combined own Scope 1 and market-based Scope 2 GHG emissions (group-wide)”. Consequently, the greenhouse gases covered by the target and considered in the metrics are consistent with the greenhouse gas inventory.
Relative to the total amount of Scope 1 and market-based Scope 2 emissions reported for 2025, the target covers just under 60% of the greenhouse gas inventory.
Without considering the ContiTech group sector, coverage exceeds 90%.
The scope of the main and interim targets extends to production in own tire operations.
The base year of the target is still 2019, even after the structurally required adjustments made in 2025. The base year value of the target had to be adjusted to reflect the narrowed scope and the change to an intensity target, as described above. For the intensity target in the tire business, the base year chosen is still representative in terms of external factors influencing energy consumption and related GHG emissions, as well as in terms of capacity utilization and market effects.
Consequently, a comparable reference value for the base year 2019 was modeled ex-post for the intensity target metric with the defined scope. The modeled value is approximately 0.66 tCO2e per tonne. This was derived by adjusting the previously reported reference value for the absolute reduction target of around 2.8 million tCO2e to reflect changes in the Continental Group’s scope of consolidation and the narrowed target scope, and then relating it to 2019 production volumes in the tire business. The baseline values for the share of group-wide absolute emissions can be found in the metric “Combined own Scope 1 and market-based Scope 2 GHG emissions (group-wide)”. The metric complies with the ESRS requirements for the calculation of Scope 1 and Scope 2 GHG emissions.
Continental is of the opinion that the target for Scope 1 and market-based Scope 2 emissions, adapted to the new organization, continues to be consistent with the science-based goals of the Paris Agreement. The goals outlined in the Paris Agreement include limiting global warming to a maximum well below 2°C respectively ideally to a maximum of 1.5°C. It should be noted that considerable uncertainties remain regarding the breakdown of the associated global reduction pathways down to the company level. These uncertainties include, among other things, the allocation of carbon budgets to various industrial sectors and the extent to which so-called negative emissions (carbon removals), for example, can be used by companies if the pathways, in particular the 1.5°C pathway, are exceeded to a limited extent.
Continental’s assessment is based on three considerations:
- When adjusting the scope and translating the target into an intensity target, no adjustments were made to the fundamental target pathway of the original target setting. Continental’s original climate target for absolute reductions in its group structure at that time, which was adopted in 2020 with the original base year 2019, was also reviewed by the Science Based Targets initiative (SBTi) in 2020. There has not been a revalidation of the intensity target adapted to the new organization by the SBTi and also in the reporting year 2025 it was not performed due to the major organizational changes that were implemented and planned, as well as due to the associated shifts in baseline values. In 2020, the original target that was set, as well as Continental’s former ambition for carbon neutrality were validated by the SBTi for methodological reasons based on the derived target values for 2030 and these were confirmed as in line with the Paris Agreement.
- Independently of external validations, the reduction pathway leads to a significant reduction of the emission intensity of around 80% compared with the base year. In addition, the average reduction in the target pathway until 2035 corresponds to around 10% per year versus the previous year for production in the tire business and it also takes into account the purchase of green electricity implemented since 2020. Although considerable reductions have already been achieved (see the metric “Reduction in Scope 1 and market-based Scope 2 GHG intensity related to production in the tire business”), the average remaining annual reduction of the trajectory compared to the reporting year is still more than 4% per year versus the previous year.
- Additionally, the reduction pathway is generally consistent with the sectoral decarbonization pathway that the European Commission has defined for rubber manufacturing activities in its 2025 transition pathways for selected chemical industries (“Chemicals: other”). From the European Union’s perspective, the pathways defined there align with the Paris Agreement and European climate goals.
The transition to an intensity target does not follow a specific methodology for intensity targets because there is currently no such uniform methodology applicable to tire manufacturers. The target metric used corresponds to the sector-typical specific metric used in the reporting of the Tire Industry Project (TIP), thus facilitating comparison within the tire industry. As the reduction pathway still corresponds to the original target in terms of its ambition, it indirectly reflects the methodology used. The original target followed the methodology of an absolute reduction that has been described by the SBTi in the framework “Foundations of Science-based Target Setting (Version 1.0),” including the defined underlying climate and policy scenarios. The derivation back then was based on a cross-sector emissions pathway.
Anticipated external developments and their impact on greenhouse gas emissions were not explicitly considered when setting the target. Possible changes to the frameworks for climate targets and greenhouse gas accounting, as well as potentially significant changes of the business strategy, the corporate structure, the product portfolio or the production volumes, could also result in an adjustment of the target values in the future. Continental is continuously monitoring and evaluating the relevant legal, accounting and methodological framework conditions and market mechanisms.
When setting the target, Continental considered the interests of different stakeholders (such as customers and authorities). Switching to an intensity target enables customers and investors in particular to make more specific comparisons of the performance.
To reach the targeted level of GHG emissions, Continental has identified two primary decarbonization levers:
- Continued purchase and expansion of self-generated electricity from renewable energies
Continental purchases electricity exclusively from renewable energy sources across the entire group. Various contractual instruments are used for this purpose, which are listed in the corresponding metrics. When electricity can be self-generated from renewable sources, these instruments are reduced accordingly. Continuation of this approach allows to avoid market-based Scope 2 GHG emissions from electricity consumption. The purchase of steam and heat generated from renewable sources is also being gradually expanded further. - Technological transformation
This lever is closely linked to operational processes and is reflected in the planning for the technological transformation of tire production. It consists primarily of sub-levers such as the gradual phase-out of fossil fuels, the switch to biofuels and biomass as well as, in particular, an increased electrification of production processes that were previously powered by fossil fuels.
According to Continental’s assessment, the GHG reductions targeted with the intensity target will be fully (i.e. 100%) achieved through a combination of the two aforementioned decarbonization levers by 2035. The two levers are inextricably linked, and both have a simultaneous effect on Scope 1 and Scope 2 emissions. Any further breakdown of the contributions or of Scope 1 and Scope 2 is therefore not meaningful.
Continental views increasing energy efficiency primarily not as direct lever but rather as a supporting lever for target achievement.
From Continental’s perspective, implementing these levers at the pace required to achieve the target is in line with the Paris Agreement.
The operationalization of these decarbonization levers through the key actions is reflected in the defined and continuously refined target-related reduction plan, which Continental uses to create a framework for achieving the target.
Especially in view of uncertainties in external conditions, such as regarding accounting questions, Continental has not yet set a “time-bound net-zero target” as a public sustainability target for the steps to come beyond 2035. The target-related levers respectively actions remain relevant beyond the target year. Continental aims to consistently pursue the key actions described beyond the target as we are convinced that the global economy, and therefore also Continental, must transition to carbon neutrality.
Continental’s progress regarding the set emissions reduction target can be derived from the metric “Greenhouse gas intensity related to production in the tire business”.
Progress is measured using the specific metric introduced in the reporting year and monitored by the Sustainability Steering Committee
Metrics for target achievement related to Scope 1 and Scope 2 emissions
The continued successful implementation of key actions in the reporting year resulted in a significant reduction compared with the previous year in greenhouse gas intensity related to production in the tire business, from 0.23 to 0.20 tCO2e per tonne of production.
The progress achieved by 2025 was slightly ahead of the trajectory expected by Continental under the target-related reduction plan.
The improvement in GHG intensity in the tire business, together with the structural effects of the spin-off of the former Automotive and Contract Manufacturing group sectors, also led to a substantial reduction in absolute combined own Scope 1 and market-based Scope 2 GHG emissions at the group level.
| Previous years | Milestones and target years | |||||
| Base year (2019) | 2024 | 2025 | Δ PY in % | 2030 target | 2035 target | |
| Greenhouse gas intensity related to production in the tire business, in tCO2e per t | 0.66 | 0.23 | 0.20 | ‑11 | 0.17 | 0.13 |
Definitions, assumptions and calculation methods:
Greenhouse gas intensity related to production in the tire business
- Greenhouse gas intensity of gross relative Scope 1 and market-based Scope 2 GHG emissions, as shown in the table “Scope 1 and Scope 2 GHG emissions” (page 134).
- Production in the tire business is measured as the gross production volume based on individual production sites, their respective production volumes and product specifications.
- The following greenhouse gases are covered: carbon dioxide (CO2); methane (CH4); nitrous oxide (N2O); sulfur hexafluoride (SF6); nitrogen trifluoride (NF3); hydrofluorocarbons (HFCs); perfluorocarbons (PFCs).
- As part of the target adjustment in the reporting year, the reference value for the base year 2019 was modeled on the new structure and as an intensity target. It is subject to uncertainties due to the retroactive calculation. See also the explanations of the calculation provided in the text.
- The metric is entity-specific.
|
2025 |
2024 |
Combined own Scope 1 and market-based Scope 2 GHG emissions, in million tCO2e (group-wide) | 0.707 | 0.833 |
Definitions, assumptions and calculation methods:
Combined own Scope 1 and market-based Scope 2 GHG emissions
- Includes gross Scope 1 and market-based Scope 2 GHG emissions, as shown in the table “Scope 1 and Scope 2 GHG emissions” (page 134).
- The following greenhouse gases are covered: carbon dioxide (CO2); methane (CH4); nitrous oxide (N2O); sulfur hexafluoride (SF6); nitrogen trifluoride (NF3); hydrofluorocarbons (HFCs); perfluorocarbons (PFCs).
- The calculation is performed in accordance with the assumptions and methodologies set out in the corresponding table for Scope 1 and Scope 2 GHG emissions
- - The metric is entity-specific.
Key actions for target achievement related to Scope 1 and Scope 2 emissions
Continental has defined concrete key actions to achieve its 2035 target for the reduction of Scope 1 and market-based Scope 2 GHG emissions related to production in the tire business. Corresponding reduction measures are embedded in operational activities and are gradually being developed for and implemented by the individual entities. The decentralized approach pursued leads to a large number of actions that will be completed in the short to long term through specific projects with individual timelines.
Continental’s climate change mitigation actions cover, in accordance with the target, the production in own operations in the tire business. Comparable actions for the ContiTech group sector, which in view of the planned organizational changes is no longer included in the target, are no longer part of the target-related reduction plan.
The target-related reduction plan represents the internal framework for the key actions required to achieve the emissions reduction target. In doing so, it focuses on the most important levers (see the Targets related to Scope 1 and Scope 2 emissions subsection), which are operationalized on an ongoing basis through specific actions spanning the entire target period:
- Continued purchase and expanded self-generation of electricity from renewable energies
Continental purchases electricity exclusively from renewable energy sources across the entire group. In doing so, Continental makes use of green electricity contracts, power purchase agreements and other contractual instruments. For volumes of purchased electricity that are not covered by contractual instruments, Continental purchases energy attribute certificates that comply with specified quality criteria. This key action is implemented by the respective entities in close cooperation with the central purchasing and environmental departments based on externally purchased and reported electricity volumes and through corresponding instruments. Continental is also ramping up its investments to expand capacity for self-generation of electricity from renewable energies. - Technological transformation
Technological transformation is carried out by the responsible entities with support from central functions, particularly manufacturing. As part of specific programs, suitable concrete actions for the respective locations and production processes, as well as the sequence for their implementation at location level are analyzed and decided upon. Especially for the next phases of the reduction plan and beyond, electrification of production plays a key role here. It enables, in combination with electricity from renewable energies, the avoidance of production-related (market-based) greenhouse gas emissions.
At the tire plant in Lousado, Portugal, an electric boiler was commissioned already in 2024 and continued to be used during the reporting year. The boiler generates the steam required for production processes and can serve as a pilot for other locations. In doing so, gas previously used as an energy source for steam generation is replaced by electricity. In 2025, all tire plants worldwide established the prerequisites for switching steam generation to alternative, lower-emission fuels such as natural gas, biomass or wood pellets. Additionally, photovoltaic systems for renewable electricity generation were installed at plants in Kalutara, Sri Lanka; Lousado, Portugal; and Timisoara, Romania during the reporting year.
Similar projects addressing the identified levers for target achievement are implemented at various locations, considering technical and economic aspects. Projects are selected as part of the general investment process, applying the same decision criteria used in any other capital allocation. The investment budget is determined as part of regular financial planning. The key actions for target achievement are enabled and implemented by allocating financial and other resources.
The metrics for achieved and expected GHG emissions reductions as a result of the implementation of such projects are set out in the table below.
| Reduction in Scope 1 and market-based Scope 2 GHG intensity related to production in the tire business | Achieved by 2025 | Achieved by 2024 | Expected further reduction 2026–2035 |
| Reduction in Scope 1 and market-based Scope 2 GHG intensity related to production in the tire business, in tCO2e per t | 0.46 | 0.44 | 0.07 |
Definitions, assumptions and calculation methods:
General information
- The data is collected by the locations.
Achieved Scope 1 and market-based Scope 2 GHG reduction in terms of intensity in production in the tire business
- The metric is calculated as the difference between Scope 1 and market-based Scope 2 GHG intensity in production in the tire business from the 2019 base year of the public sustainability target and Scope 1 and market-based Scope 2 GHG intensity in production in the tire business in the reporting year.
Expected further reduction 2026–2035
- The metric is calculated as the difference between Scope 1 and market-based Scope 2 GHG intensity in production in the tire business in the reporting year and the target value for Scope 1 and market-based Scope 2 GHG intensity in production in the tire business in 2035 (see the Targets related to Scope 1 and Scope 2 emissions subsection).
Capital expenditure and operating expenditure for key actions for target achievement related to climate change
The changes in operating expenditure (OpEx) were mainly due to the adjustment of the target following the spin-off of the former Automotive and Contract Manufacturing group sectors.
Overall, reported capital expenditure (CapEx) increased significantly in 2025. The main reasons were the intensified implementation of key actions and the first-time inclusion of capital expenditure for expanding in-house renewable energy generation. These two effects clearly outweighed the reductions in reported capital expenditure resulting from the target adjustment and the structural effect of the spin-off.
The reported planned capital expenditure and operating expenditure were adjusted accordingly. Newly planned photovoltaic and wind power installations, as well as heat pumps, were the drivers behind the substantial increase in planned capital expenditure over the next five years.
| OpEx and CapEx of key actions for target achievement related to Scope 1 and Scope 2 emissions, in € millions | 2025 | 2024 | Planned 2026–2030 |
| OpEx | 3 | 5 | 13 |
| CapEx | 11 | 3 | 104 |
Definitions, assumptions and calculation methods:
General information
- The public sustainability target covers Scope 1 and market-based Scope 2 GHG emissions.
- The time horizon applied is in line with the approved long-term planning.
- Values for 2024 are reported according to the former targets for the Continental Group and the 2024 organizational structure.
OpEx and planned OpEx
- Data is collected at the level of key actions. Includes OpEx for key actions for target achievement related to the reduction in intensity of Scope 1 and market-based Scope 2 GHG emissions for the Tires group sector.
CapEx and planned CapEx
- Data is collected at the level of key actions. Includes CapEx for key actions for target achievement related to the reduction in intensity of Scope 1 and market-based Scope 2 GHG emissions for the Tires group sector.
Interrelationship between CapEx and OpEx
Information on capital expenditure (CapEx) can be found in Note 1 of the Notes to the Consolidated Financial Statements. The information refers to Capital expenditure in the intangible assets (Note 13), Property, plant and equipment (Note 14) and Leases (Note 15) presented in the Notes to the Consolidated Financial Statements.
Continental does not report any Taxonomy-aligned economic activities and therefore does not provide a capital expenditure plan in accordance with European Commission Delegated Regulation (EU) 2021/2178.
CapEx for key actions for target achievement related to climate change mitigation mainly falls under Taxonomy-eligible capital expenditure.
Operating expenditure in accordance with Commission Delegated Regulation (EU) 2021/2178 relates to the total of maintenance costs, building refurbishment actions, short-term leasing and research and development costs. The key actions for target achievement related to climate change are defined differently (see the Climate Change (ESRS E1) section, Key actions for target achievement related to Scope 1 and Scope 2 emissions subsection).
Metrics related to Scope 1 and Scope 2 emissions
The reduction in Scope 1 and location-based Scope 2 emissions was mainly due to the spin-off of the former Automotive and Contract Manufacturing group sectors as well as significantly lower emissions in the ContiTech group sector and the holding company. By contrast, there was a slight increase in emissions in the Tires group sector. Both group sectors, however, recorded a significant reduction in market-based Scope 2 emissions.
At the same time, the percentage share of energy purchased with contractual instruments increased across the company in the reporting year.Scope 1 and Scope 2 GHG emissions |
Retrospective |
Milestones and target years |
||||||
Base year |
2024 |
2025 |
Δ PY in % |
2025 |
2030 |
2035 |
Reduction rate (annual % of target / base year) |
|
Scope 1 GHG emissions |
|
|
|
|
|
|
|
|
Gross Scope 1 GHG emissions, |
— |
671,731 |
599,607 |
-11 |
— |
— |
— |
— |
Consolidated accounting group, in tCO2e |
— |
671,731 |
599,607 |
-11 |
— |
— |
— |
— |
Investees, in tCO2e |
— |
0 |
0 |
0 |
— |
— |
— |
— |
Percentage of Scope 1 GHG emissions from regulated emissions trading systems, in % |
— |
19.4 |
21.3 |
10 |
— |
— |
— |
— |
Scope 2 GHG emissions |
|
|
|
|
|
|
|
|
Gross location-based Scope 2 GHG emissions, in tCO2e |
— |
1,673,9031 |
1,093,196 |
-35 |
— |
— |
— |
— |
Consolidated accounting group, in tCO2e |
— |
1,673,9031 |
1,093,196 |
-35 |
— |
— |
— |
— |
Investees, in tCO2e |
— |
0 |
0 |
0 |
— |
— |
— |
— |
Gross market-based Scope 2 GHG emissions, in tCO2e |
— |
161,504 |
107,776 |
-33 |
— |
— |
— |
— |
Consolidated accounting group, in tCO2e |
— |
161,504 |
107,776 |
-33 |
— |
— |
— |
— |
Investees, in tCO2e |
— |
0 |
0 |
0 |
— |
— |
— |
— |
Percentage of energy purchased with contractual instruments, in % |
— |
84.7 |
86.3 |
2 |
— |
— |
— |
— |
Definitions, assumptions and calculation methods:
General information
- Definitions and calculations according to GHG Protocol Corporate Standard (version 2004).
- The data is collected by the locations. For certain locations, modeled calculations are used considering the number of employees and the type of operation.
- Emission factors from IEA Static, the GHG Protocol, DEFRA and Sphera are applied.
- Continental includes all emissions of the Continental Group’s relevant fully consolidated companies. Continental has no operational control of investees; therefore, they are not relevant for Scope 1 and Scope 2 emissions.
Gross Scope 1 GHG emissions
- Emission factors for refrigerants in accordance with Regulation (EU) 2024/573 of the European Parliament and of the Council from February 7, 2024 on fluorinated greenhouse gases are considered. These are based on IPCC 4 and not on the more recent IPCC 6; this does not result in any significant effects.
Percentage of Scope 1 GHG emissions from regulated emissions trading systems
- Includes locations that fall under the EU Emissions Trading System (EU ETS).
- Includes Scope 1 GHG emissions that fall under the EU ETS.
Gross location-based Scope 2 GHG emissions
- Average electricity grid emission factors by country are applied.
1 Adjustment of the prior-year figure of 1,424,774 tCO2e by 249,129 tCO2e to 1,673,903 tCO2e in accordance with ESRS 1.96 and due to a correction in the data collection for the metric.
Gross market-based Scope 2 GHG emissions
- Contract-specific emission factors are applied.
- Market-based gross Scope 2 GHG emissions from electricity consumption amounted to 0 tCO2e in the reporting year. The accounting approach for electricity purchased from renewable energy sources is based on quality criteria aligned with RE100 requirements. Electricity is purchased through contractual instruments for renewable energy (on-site PPAs, off-site PPAs, green tariffs, energy attribute certificates) from wind, hydro, geothermal, and solid, liquid and gaseous biomass sources.
- Emissions from steam and district heat are calculated using confirmed emission factors from local energy suppliers. If these factors are not available, location-based emission factors (see Gross location-based Scope 2 GHG emissions) are used. For these instruments, electricity from nuclear power and waste incineration is not counted as electricity from renewable sources.
Percentage of energy purchased with contractual instruments
- Includes energy purchased with contractual instruments for electricity (on-site PPAs, off-site PPAs, green tariffs, energy attribute certificates) and for other energy sources (particularly steam and district heat from renewable sources).
- The figure represents the share of energy purchased with contractual instruments in relation to the total amount of energy purchased with relevance for Scope 2.
Metrics related to energy consumption and energy mix
In the reporting year, Continental’s total energy consumption declined due to both the spin-off of the former Automotive and Contract Manufacturing group sectors and lower consumption in the ContiTech group sector. Absolute energy consumption from fossil sources decreased in the Tires and ContiTech group sectors. Because the former Automotive and Contract Manufacturing group sectors had a significantly lower share of fossil energy sources in their total energy consumption, the relative share of fossil energy sources increased overall in the reporting year.
| Energy consumption and energy mix, in MWh | 2025 | 2024 |
| (1) Fuel consumption from coal and coal products | 40,631 | 82,476 |
| (2) Fuel consumption from crude oil and petroleum products | 115,529 | 129,421 |
| (3) Fuel consumption from natural gas | 2,581,542 | 2,840,436 |
| (4) Fuel consumption from other fossil sources | 89,115 | 61,634 |
| (5) Consumption of purchased or acquired electricity, heat, steam or cooling from fossil sources | 524,943 | 754,333 |
| (6) Total energy consumption from fossil sources | 3,351,760 | 3,868,301 |
| (7) Total energy consumption from nuclear sources | 0 | 0 |
| (8) Fuel consumption from renewable sources | 92,675 | 110,068 |
| (9) Energy consumption of purchased or acquired electricity, heat, steam or cooling from renewable sources | 3,315,668 | 4,219,044 |
| (10) Consumption of self-generated non-fuel renewable energy | 34,484 | 26,652 |
| (11) Total energy consumption from renewable sources | 3,442,827 | 4,355,765 |
| (12) Total energy consumption | 6,794,587 | 8,224,066 |
Definitions, assumptions and calculation methods:
General information for items (1) to (12)
- If required, conversion factors are used to convert fuel consumption into MWh.
- The data is collected by the locations. For certain locations, modeled calculations are used considering the number of employees and the type of operation.
- In addition, December consumption is estimated for some locations if the necessary data or proofs were not yet available at the time of reporting.
- Classification into renewable and non-renewable energy sources follows the market-based method.
(1) Fuel consumption from coal and coal products
- Includes consumption of coal and lignite.
(2) Fuel consumption from crude oil and petroleum products
- Includes consumption of diesel, gasoil, gasoline and heating oil.
- The energy consumption of company vehicles worldwide is modeled and uses the energy consumption of German company vehicles as a benchmark.
(3) Fuel consumption from natural gas
- Includes consumption of natural gas.
(4) Fuel consumption from other fossil sources
- Includes consumption of liquefied petroleum gas (LPG), propane and liquid butane.
(5) Consumption of purchased or acquired electricity, heat, steam or cooling from fossil sources
- Includes consumption of purchased district heat and steam from fossil sources.
(6) Total energy consumption from fossil sources
- Total of items (1) to (5).
(7) Total energy consumption from nuclear sources
- Includes energy consumption from nuclear sources.
(8) Fuel consumption from renewable sources
- Includes consumption of biomass, biofuels, biomethane and green hydrogen.
(9) Energy consumption of purchased or acquired electricity, heat, steam or cooling from renewable sources
- Includes the purchased electricity mix, electricity from renewable sources with contractual instruments (on-site PPAs, off-site PPAs, green tariffs, energy attribute certificates) as well as purchased steam and district heat from renewable sources.
(10) Consumption of self-generated non-fuel renewable energy
- Includes consumption of self-generated electricity from renewable sources.
(11) Total energy consumption from renewable sources
- Total of items (8) to (10).
(12) Total energy consumption
- Calculated as the total of items (6), (7) and (11).
cope 3 Emissions, Value Chain Resilience and Transition
Material impacts, risks and opportunities in the Scope 3 emissions, value chain resilience and transition IRO cluster
ID |
Short description |
Type of IRO |
Primary |
Explanation |
||||
4 |
Scope 3: emissions in the value chain (excluding use phase) |
Potential and actual negative impact |
Short-term |
From a climate perspective, significant aspects of Continental’s value chain are material procurement and end-of-life treatment of products. Continental sources a wide range of materials and semi-finished products through global supply chains, including natural rubber, synthetic rubber, other polymers, chemicals and steel. These supply chains are associated with industry-inherent greenhouse gas emissions. The end-of-life treatment of Continental’s products involves various processes, significant parts of which are inherently associated with greenhouse gas emissions. Also when considering the management approach, this results in material actual impacts. |
||||
5 |
Scope 3: emissions in the value chain |
Potential and actual negative impact |
Short-term |
Continental’s products are installed in vehicles or industrial machines. During use, they can influence or contribute to energy consumption. At present, both mobility and the industrial processes of our customers still predominantly rely on fossil fuels. This results in portfolio- and industry-inherent greenhouse gas emissions associated with the product use phase. Also when considering the management approach, this results in material actual impacts. |
||||
6 |
Higher costs for materials/services related to climate change mitigation (APS scenario) |
Abstract |
Long-term |
Continental sources materials and semi-finished products from industries with relevant greenhouse gas emissions, such as natural rubber, synthetic rubber, other polymers, chemicals and steel. This results in an industry-inherent risk exposure linked to the pace of transformation in response to climate change. In a scenario where climate targets announced by markets and customers are pursued consistently, requirements in certain markets could tighten faster than the supply chain can adapt. This could lead to materially higher costs for materials and semi-finished products. |
||||
7 |
Higher costs for materials/ |
Abstract |
Medium-term |
Continental sources materials and semi-finished products from industries with relevant greenhouse gas emissions, such as natural rubber, synthetic rubber, other polymers, chemicals and steel. This results in an industry-inherent risk exposure linked to the pace of transformation in response to climate change. In a scenario to be analyzed according to the ESRS – characterized by highly ambitious regulations allowing no or only limited overshoot of a 1.5°C temperature increase – the regulatorily required pace of decarbonization could significantly exceed the adaptation speed of the supply chain. This could lead to materially higher costs for materials and semi-finished products. |
||||
8 |
Loss of sales in connection with our portfolio and |
Abstract |
Long-term |
Continental’s products are installed in vehicles or industrial machines. This results in a portfolio-related exposure to market risks linked to the transformation of mobility and industry in response to climate change. In a scenario where climate targets announced by markets and customers are pursued consistently, requirements in certain markets could tighten faster than industries in general and Continental’s product portfolio can adapt. Depending on the specific regulation, this could lead to material sales losses in certain markets or product segments. |
||||
9 |
Loss of sales in connection with our portfolio and climate change (1.5°C scenario without overshoot) |
Abstract |
Medium-term |
Continental’s products are installed in vehicles or industrial machines. This results in a portfolio-related exposure to market risks linked to the transformation of mobility and industry in response to climate change. In a scenario to be analyzed according to the ESRS – characterized by highly ambitious regulations allowing no or only limited overshoot of a 1.5°C temperature increase – the regulatorily required pace of decarbonization could significantly exceed the adaptation speed of the industries. This could lead to material sales losses as demand for large parts of the portfolio would decline. |
||||
10 |
Growth due to climate change mitigation regulations |
Opportunity |
Long-term |
Continental’s product portfolio serves markets and industries that are undergoing transformation in response to climate change and are subject to increasing regulation (e.g. requirements for energy efficiency or greenhouse gas reduction). As a result, changing product requirements (e.g. tires for electric vehicles) in these markets could create general potentials for additional sales growth and new business as well as further competitive differentiation, which may also positively affect achievable margins. Based on its portfolio orientation and existing management approaches, Continental assumes to be able to leverage these opportunities. |
||||
Management approach for Scope 3 emissions, value chain resilience and transition
Continental is convinced that mobility and the global economy must transition to carbon neutrality. We support the principles and goals of the Paris Agreement and foster actions to reduce greenhouse gas emissions and promote low-carbon solutions along our value chain (Scope 3), as described in our sustainability ambition. To reduce risks and seize opportunities, Continental has established a corresponding management approach and is continuing to develop it further. This takes into account both upstream and downstream value chains as well as the varying speeds of transformation among our customers and suppliers and in our different sectors and markets. Continental has not defined a quantified, time-bound public sustainability target for Scope 3 emissions but is committed to reducing Scope 3 emissions through the management approach and the wide range of processes described below.
The management approach and the different associated processes cover the entire Continental Group and the global product portfolio. The processes relate in particular to the highest-volume categories of Scope 3 GHG emissions in accordance with the GHG Protocol:
- Upstream value chain, including purchased goods and services from our suppliers (category 1);
- Indirect Scope 3 GHG emissions from the use phase of sold products (category 11);
- Emissions from end-of-life treatment of sold products (category 12).
In terms of purchased raw materials, the processes focus primarily on suppliers that account for the highest shares of Scope 3 emissions. There are no general geographical restrictions or product group limitations. However, due to the complexity of Scope 3 GHG emissions, each of these three areas has a specific focus on material and influenceable elements.
Oversight and adjustment of the management approach takes place within the responsible operational business functions and supporting functions, including:
- Research and development (R&D), product development, market-facing functions such as marketing and sales, and sustainability for all three areas;
- Purchasing and supply chain for the upstream value chain;
- Additional specific functions for end-of-life treatment of products (see the functions specified in the Resource Use and Circular Economy (ESRS E5) section, Circularity subsection).
Monitoring is performed at the respective business levels and overall by the Executive Board.
For managing Scope 3 emissions, value chain resilience and transition, transparency regarding the major categories of Scope 3 GHG emissions is crucial. The calculation of emissions and the continuous improvement of the underlying data models thus forms the foundation for all three focus areas of the management approach.
For the upstream value chain (category 1), the processes focus on the GHG footprint of the materials used, which is primarily influenced by technological progress in upstream industries and the choice of materials. Corresponding management practices include working with suppliers to reduce their emissions and the emissions along their supply chains. We encourage our suppliers to commit to climate change mitigation and to report their emissions and climate targets transparently. The process also involves systematically collecting emissions data and reduction targets from suppliers to identify reduction levers. This underpins the process of selecting less emission-intensive materials as part of research and development activities. These assessments allow potentially lower-emission materials to be incorporated into product design. Data availability is critical and is therefore continually expanded to facilitate the selection of lower-emission materials. A strong focus is placed on scalability and economic feasibility, and transition risks in the supply chain are also addressed: Suppliers that support the decarbonization of our purchased materials simultaneously advance their own decarbonization and thus mitigate their transition risks. This area of the management approach is closely connected to circularity processes described in the Circularity subsection.
For emissions from end-of-life treatment of products (category 12), relevant processes are outlined in the Circularity subsection. These processes indirectly influence emissions during end-of-life treatment and help to reduce emissions, even though they primarily focus on circularity aspects.
Regarding emissions from the use phase of sold products (category 11), Continental is consistently working to optimize those influencing factors that are directly related to the product. For tires, this is primarily rolling resistance, since lower rolling resistance reduces fuel and electricity consumption in vehicles, thereby lowering the corresponding associated Scope 3 emissions. In the European market, rolling resistance is rated using the EU tire label. An “A” represents the best possible category. As a premium manufacturer, Continental focuses on safety-relevant attributes such as wet braking at the highest level (see the Consumers and End-Users (ESRS S4) section, Safe mobility subsection). At the same time, Continental continuously optimizes other product properties such as rolling resistance in balance with safety-related properties. An example is the VanContact A/S Eco, introduced during the reporting year as the first all-season tire for vans to achieve an “A” rating for performance criteria of rolling resistance, noise emission and wet braking. Similarly, the ContiTech group sector is working on improving rolling resistance for conveyor belts, contributing to energy efficiency in conveyor systems used in mountain and open-pit mining. Conveyor belt rolling resistance can also be assessed using an efficiency label, developed by Continental together with the US Association for Rubber Products Manufacturers.
Other influencing factors in the use phase are the drive type and energy source of vehicles fitted with Continental tires. These have a material impact on emissions in the use phase but are outside Continental’s direct sphere of influence. Continental’s research and product development activities are therefore focused on actively supporting the transition to electric mobility and alternative drive systems. A basic prerequisite is that Continental’s tires meet the requirements of electric vehicles. Improved rolling resistance, for example, helps to extend range. Moreover, electric vehicles are often heavier than comparable vehicles with combustion engines due to battery weight. Therefore, tires must be designed for higher loads. Continental has been producing tires with the “HL” load index code since 2021. Noise reduction is also especially relevant for electric-vehicle tires, as the absence of engine noise makes others noises more noticeable. In 2025, 17 of the world’s 20 highest-volume manufacturers of electric vehicles relied on Continental’s technological expertise for their original equipment.
Continental’s sustainability ambition forms the overarching framework for developing and implementing specific processes and actions. In addition, area-specific internal guidelines addressing climate change mitigation directly or indirectly govern processes at various organizational levels.
The management approach is also based on the GHG Protocol and related standards, such as the Corporate Value Chain (Scope 3) Accounting and Reporting Standard, as external frameworks for CO2 emissions accounting, as well as relevant regulatory requirements for specific products, such as tire labeling.
The management approach and associated actions are geared toward customer requirements and investor expectations. Intensive discussions with suppliers are also a core element of the process.
Continental communicates its approach to managing Scope 3 emissions, value chain resilience and transition both externally and internally through various channels. External communication takes place, among other things, via press releases, media coverage, appearances at trade fairs and direct dialogue with customers, suppliers, investors and other market participants. Internally, information is communicated for example via the company-wide intranet, topic-specific conferences, working groups and cross-functional exchange formats.
Continental’s immediate climate change mitigation program Net|Zero|Now was discontinued in fiscal 2025. No further purchases or cancellations of emission certificates took place in the reporting year, and none are planned.
Metrics related to Scope 3 emissions, value chain resilience and transition
Significant Scope 3 GHG emissions
Scope 3 emissions decreased significantly in the reporting year. The changes were mainly due to the spin-off of the former Automotive and Contract Manufacturing group sectors, especially in category 1. Purchased goods and services and category 11. Use of sold products. In addition, there was a minor further effect on total Scope 3 emissions resulting from the change of reporting the significant Scope 3 emissions compared with the reporting of all 15 categories in the previous year.
Significant Scope 3 GHG emissions, in tCO2e |
Retrospective |
Milestones and target years |
||||||||
Base year |
2024 |
2025 |
Δ in % |
2025 |
2030 |
2035 |
Reduction rate (annual % of target / base year) |
|
||
Total gross indirect (Scope 3) GHG emissions |
— |
99,418,244 |
82,752,862 |
-17 |
|
— |
— |
— |
|
|
1. Purchased goods and services |
— |
14,270,642 |
8,810,712 |
-38 |
|
— |
— |
— |
|
|
2. Capital goods |
— |
826,610 |
462,347 |
-44 |
|
— |
— |
— |
|
|
3. Fuel and energy-related activities (not included in Scope 1 or Scope 2) |
— |
458,530 |
380,009 |
-17 |
|
— |
— |
— |
|
|
4. Upstream transportation and distribution |
— |
977,819 |
511,110 |
-48 |
|
— |
— |
— |
|
|
5. Waste generated in operations |
— |
32,368 |
22,830 |
-29 |
|
— |
— |
— |
|
|
6. Business travel |
— |
64,428 |
34,593 |
-46 |
|
— |
— |
— |
|
|
11. Use of sold products |
— |
78,510,936 |
68,540,783 |
-13 |
|
— |
— |
— |
|
|
12. End-of-life treatment of products |
— |
3,663,651 |
3,990,477 |
9 |
|
— |
— |
— |
|
|
Definitions, assumptions and calculation methods:
General information
- Scope 3 GHG emissions are calculated in accordance with the Corporate Value Chain (Scope 3) Accounting and Reporting Standard 2011 and supplementary standards.
Total calculated gross indirect (Scope 3) GHG emissions
- For 2025: total significant Scope 3 GHG emissions. For 2024: total of all 15 categories of Scope 3 GHG emissions.
Calculated indirect Scope 3 GHG emissions – purchased goods and services
- Purchased goods and services relate to the extraction, production and transportation of goods purchased by the company in the reporting year. Only goods and services relevant for category 1 according to the GHG Protocol are included, including all upstream emissions (cradle-to-gate).
- Emissions for production materials are calculated on a weight basis and for other goods and services on a cost basis. Emission factors from Sphera, Ecoinvent, supplier-specific emission factors or internally determined group sector-specific and business area-specific GHG factors are used to calculate the emissions.
- For purchased product groups for which not all weight data is available, the missing share is extrapolated using the average method. Expenditures for non-production materials and services are multiplied by either the specific emission factors from DEFRA or an internally determined emission factor. As part of this expenditure-based method, a small share of data is extrapolated.
Calculated indirect Scope 3 GHG emissions – capital goods
- Includes capital goods that are purchased in the reporting year.
- Expenditures for capital goods are multiplied by either the specific emission factors from DEFRA or an internally determined emission factor. As part of this expenditure-based method, a small share of data is extrapolated.
Calculated indirect Scope 3 GHG emissions – fuel and energy-related activities (not included in Scope 1 or Scope 2)
- Fuel and energy-related activities are defined as extraction, production, transportation and transportation losses of purchased fuels and energy that are not covered by Scope 1 or Scope 2.
- For energy consumption, the specific emission factors from DEFRA are used within the framework of an average data method.
- Country-specific electricity grid emission factors are calculated based on the DEFRA calculation method. Well-to-tank emission factors are considered in this category.
- An average transmission loss of 5%, as recommended by DEFRA, is applied to steam and district heat.
- For renewable electricity, it is assumed that the mix consists of 50% photovoltaics and 50% wind power.
Calculated indirect Scope 3 GHG emissions – upstream transportation and distribution
- Upstream transportation and distribution are defined as the transportation of goods from direct suppliers to the company as well as within the company and to the customer, if paid for by the company and using third-party vehicles and facilities, including emissions from transportation services.
- For this category, average data, costs and GHG data from service providers are applied using the distance-based method, with the missing share extrapolated.
- Apart from CO2 data from service providers, the emissions for each mode of transport (road, rail, sea and air) are determined through calculations, with a small share of transport modes estimated.
- The basis for calculation includes logistics expenses, distance per weight and transport mode, multiplied by specific emission factors from Sphera or DEFRA.
- The emissions of the ContiTech group sector are primarily calculated based on GHG data from service providers.
Calculated indirect Scope 3 GHG emissions – waste generated in operations
- Waste generation is multiplied by specific emission factors from DEFRA using an average data method for different waste categories, only considering emissions associated with landfill sites and incinerators.
Calculated indirect Scope 3 GHG emissions – business travel
- Travel booking service providers report GHG emissions for business trips. Hotel overnight stays are included as optional data. The various travel options are also considered and calculated.
- Some of this external primary data refers to emission factors from DEFRA.
- Business travel that may not have been booked through these service providers is estimated based on expert assumptions.
Calculated indirect Scope 3 GHG emissions – use of sold products
- This category includes indirect emissions from the ContiTech and Tires group sectors during the use phase which are optional to report according to the GHG Protocol. For this category, tank-to-wheel emission factors are used.
- Indirect emissions in the area of specialty tires, non-tire products and products in the retail business of Tires group sector as well as the industrial business of the ContiTech group sector, except for the conveyor belt business, are not included in the calculation.
- For the ContiTech group sector, the calculation method is based on the expected product service life taken from selected automotive manufacturers and the sold product weight, applying average data methods with emission factors from ICCT and DEFRA as well as representative consumption values for battery electric vehicles.
- To calculate ContiTech group sector conveyor belt use phase emissions, an average belt weight, related idle power load, belt runtime per year and lifetime are assessed based on internal data and expert assessments.
- The Tires group sector calculation model is based on tire industry-aligned product category rules (PCRs). Energy consumption of sold tires is calculated by considering rolling resistance and acceleration resistance.
- Furthermore, fuel-specific emission factors from DEFRA, which are based on the PCR powertrain mix in the respective markets, are used for the Tires group sector. All drive types considered within the PCRs are represented in the models. Within the PCRs, drive types are considered from a threshold of 10% within the relevant markets.
Calculated indirect Scope 3 GHG emissions – end-of-life treatment of products
- Includes waste disposal and treatment of sold products at the end of their life cycle.
- The weight of sold products is multiplied by the specific emission factors from Sphera in accordance with the disposal and recycling type. In the absence of weight information for individual product groups, emissions are calculated based on information on purchased goods. The methodology for calculating the metric was further developed in the reporting year.
- Internal expert assessments and industrial data are used in the classification of the disposal and recovery type.
Scope 3 emissions using primary data
Thanks to an improved data basis, the share of Scope 3 GHG emissions calculated using primary data increased significantly. In the Tires group sector, specific processes were established with suppliers of production materials, enabling primary data to be used for emissions calculations for the first time in the reporting year. As a result, around half of the emissions of production materials in Scope 3 category 1 for the Tires group sector could be represented using primary data. Due to methodological factors and the high proportion of emissions from category 11 (Use of sold products), the share of all Scope 3 GHG emissions remained in the mid-single-digit percentage range in 2025. The spin-off of the former Automotive and Contract Manufacturing group sectors had no effect on this change.
| Scope 3 emissions using primary data | 2025 | 2024 |
| Share of Scope 3 GHG emissions calculated using primary data, in % | 3.44 | 0.01 |
| Share of Scope 3 GHG emissions related to category 1 (purchased goods and services), calculated using primary data, in % | 31.97 | — |
| Share of Scope 3 GHG emissions related to production materials within category 1, calculated using primary data, in % | 35.65 | — |
Definitions, assumptions and calculation methods:
- Includes emissions for which primary data is available in the form of a product carbon footprint that has either been verified externally or has undergone and passed successfully an internal validation process.
- Includes Scope 3 GHG emissions calculated based on primary data.
- Scope 3 GHG emissions based on primary data are set in relation to total Scope 3 GHG emissions.
- Scope 3 GHG emissions based on primary data are set in relation to Scope 3 GHG emissions – category 1.
- Scope 3 GHG emissions based on primary data are set in relation to the share of emissions of production materials from Scope 3 GHG emissions – category 1.
- Both metrics related to the share of primary data for category 1 were reported for the first time in the reporting year. A comparable figure for 2024 could not be calculated due to organizational changes.
Climate Change Adaptation
Material impacts, risks and opportunities in the climate change adaptation IRO cluster
ID |
Short description |
Type of IRO |
Primary |
Explanation |
||||
11 |
Business interruptions and higher operating costs/ |
Abstract and tangible risk |
Long-term/ |
Continental operates numerous locations worldwide in regions with different climatic conditions. This results in an inherent exposure to physical effects of climate change, such as increasing extreme weather events and long-term shifts in climate patterns. In a scenario of a moderate rise in temperature levels, increased acute events and intensified chronic changes in climatic conditions could lead to business interruptions or require adaptation measures, resulting in higher operating costs and investments. A tangible risk exposure related to higher operating costs and investments arises in particular for locations that may already be affected by more frequent heat waves in the medium term, which could lead to an increase in corresponding investments in infrastructure and operating costs (e.g. cooling and insulation). |
||||
12 |
Business interruptions and higher operating costs/ |
Abstract |
Long-term |
Continental operates numerous locations worldwide in regions with different climatic conditions. This results in an inherent exposure to physical effects of climate change, such as increasing extreme weather events and long-term shifts in climate patterns. In a scenario of a strong increase in temperature levels, significantly increased acute events and intensified chronic changes in climatic conditions could lead to business interruptions or require adaptation measures, resulting in higher operating costs and investments. |
||||
13 |
Supply chain interruptions and higher costs for materials/services due to physical effects of climate change (SSP5 scenario) |
Abstract |
Long-term |
Continental’s supply chain spans numerous countries and includes a wide range of industries. This global structure results in an inherent exposure to physical effects of climate change, such as increasing extreme weather events and long-term shifts in climate patterns. In a scenario of a strong increase in temperature levels, significantly increased acute events and intensified chronic changes in climatic conditions could lead to interruptions or limited availability of certain materials and semi-finished products, particularly for bio-based materials. This could lead to higher costs for materials and semi-finished products due to market dynamics. |
||||
Management approach for climate change adaptation
Continental has established a management approach to mitigate the risk of rising operating and investment costs or business interruptions due to physical climate change. This includes technical measures to adapt production facilities and measures to encourage behavioral changes among employees as well as processes for selecting production plants and new locations.
At the same time, the management approach also addresses physical risks in the supply chain to ensure continuity, strengthen their resilience and prevent interruptions. Physical climate risks are one of many potential causes of supply chain interruptions. They are taken into account as part of general supply chain management.
This management approach covers Continental’s own operations. With regard to the supply chain, the management approach mainly covers production material supply chains and varies in terms of the depth of supply chain tiers considered.
Primary responsibility for implementing risk mitigation actions related to production facilities and locations lies with the operational business, supported by various functions across the organization, such as real estate management, Continental’s internal insurance services and technical departments specializing in buildings, facilities and infrastructure. The supply chain is mainly managed by the purchasing and supply chain functions. Monitoring is embedded in various processes, including general risk management.
When selecting new operational sites, Continental considers, among other things, risks associated with existing exposure to extreme weather events, which could be amplified by climate change. To avoid introducing these potential new risks into its real estate portfolio, Continental has incorporated specific requirements into its site selection guidelines. The aim of these requirements is to gain insights into the exposure of potential sites to a variety of weather events and other natural disasters and to integrate the results of this assessment into final decision-making.
In the existing plant and real estate portfolio, climate conditions are monitored at each location. As part of the improvement and optimization of production processes and working conditions, locations assess cost-efficient options for heating, cooling and ventilation, taking into account opportunities to reduce energy and other operating costs, which is particularly relevant for risks associated with long-term changes in climate patterns (e.g. rising temperatures). Corresponding measures, including structural measures, are implemented locally through regular site management processes and in coordination with centrally supporting departments.
An additional lever for curbing increasing operating costs is to raise employees’ awareness of the effects that individual behaviors have on the development of overall energy demand. The implementation of this lever includes, for example, various training courses and campaigns promoting responsible energy use to reduce heating, cooling and ventilation costs.
Additionally, risk mitigation related to specific natural hazards and extreme weather events, taking into account current exposure, is part of the location-specific and insurance-related risk management process with the resulting organizational and technical measures such as flood prevention, emergency plans and location-specific monitoring processes. Responsibility for implementing these actions lies with the relevant operating business.
For supply chains, various aspects are considered during procurement and supply chain management, among others strategic factors such as security of supply in the event of extreme weather events, which could be exacerbated by climate change. Security of supply at our plants is continuously managed, and potential logistical challenges for goods deliveries (e.g. sea freight) are closely monitored. General risk precautions have been put in place to safeguard our supply chains. Should locations or supplier deliveries nevertheless fail, specific action plans are initiated. Further information on the relevant processes and their integration into risk management can be found in the Report on Risks and Opportunities.
The selection process for new locations and the management of the real estate portfolio follow general internal rules. In addition, Continental also has its own requirements for building construction and operation, which, for example, include factors such as insulation.
The management approach for Scope 1 and Scope 2 emissions also provides a supporting framework for reducing emissions from cooling, heating and ventilation. The internal energy efficiency campaign BEE (“be energy efficient”) in the Tires group sector serves as an important guideline for employees to adapt their behavior.
Supply chain processes are governed by a set of general internal rules for the relevant functions at different organizational levels.
For plants and locations, the management approach is indirectly based on the international standards ISO 14001 and ISO 50001 through its reference to environmental and energy management as well as to the technical building requirements, including compliance with local regulations.
For supply chains, the management approach is not based on any specific external standard.
In implementing the management approach for Continental’s own operations, in particular employee interests regarding working conditions, such as temperature and fresh air, at each location are taken into account.
For supply chains, close dialogue with customers and suppliers is a core element of the management approach.
Communication with employees regarding own operations generally takes place at location level. Detailed information on the general forms of involvement and communication with employees can be found in the Own Workforce (ESRS S1) section.
For supply chains, processes are implemented close to operational activities, so communication with internal stakeholders primarily occurs within the respective businesses. The primary form of external communication is close dialogue with customers and suppliers.
Transition Plan for Climate Change Mitigation
Continental’s partially formalized transition plan covers all relevant impacts, risks and opportunities and consists of a combination of ambitions, management approaches, targets and key actions. The management approach for Scope 1 and Scope 2 emissions, the corresponding target and the target-related reduction plan form the basis for the transition plan for climate change mitigation in own operations. In addition, the management approach for Scope 3 emissions, value chain resilience and transition is critical to the transition.
These key elements of the transition plan are embedded as described and are approved by Continental’s Executive Board, particularly with regard to the target set.
In Continental’s opinion, the transition plan is in line with the Paris Agreement, as described in the target for Scope 1 and Scope 2 emissions. For further details, see the Targets related to Scope 1 and Scope 2 emissions subsection in the Climate Change (ESRS E1) section.
Continental is not aware of being excluded from EU Paris-aligned benchmarks.
To achieve the set GHG emissions reduction target, Continental has identified two primary decarbonization levers (see the Targets related to Scope 1 and Scope 2 emissions subsection), which are addressed by the defined actions (see the Key actions for target achievement related to Scope 1 and Scope 2 emissions subsection). Furthermore, levers for Scope 3 emissions are operationalized through the described management approaches.
A detailed description of the actions and associated metrics providing information on the implementation progress of the transition plan, can be found in the Key actions for target achievement related to Scope 1 and Scope 2 emissions subsection.
As part of the IRO assessment (see the General Disclosures (ESRS 2) section, Overview of material impacts, risks and opportunities subsection), Continental analyzed the potential locked-in GHG emissions in its most important assets. The conclusion from the analysis was that, due to their immateriality, they do not jeopardize the achievement of the defined GHG emissions reduction target and do not foster any transition risks.
The sustainability strategy and management approaches for climate change are integral parts of the overall business strategy and play a key role in transitioning to a more sustainable business model. Where significant financial resources are required to implement related actions, this is taken into due account in the financial planning process as described.
Currently, Continental’s transition plan does not provide for a portfolio transition aimed at meeting the criteria for Taxonomy-aligned economic activities set out in Commission Delegated Regulation (EU) 2021/2139. In addition, Continental did not report any Taxonomy-aligned economic activities in 2025.
The changes in reported expenditure compared with the previous year resulted from the more detailed descriptions of changes in operating expenditure and capital expenditure provided in the Key actions for target achievement related to Scope 1 and Scope 2 emissions subsection.| CapEx and OpEx for target-based key actions | 2025 |
2024 |
| Total amount of current and planned CapEx and OpEx for key actions for target achievement related to Scope 1 and Scope 2 emissions, in € millions | 131 |
50 |
Definitions, assumptions and calculation methods:
- The metric explicitly covers only the key actions related to the public sustainability target and no other elements of the transition plan.
- Data is collected at the level of key actions. Includes current and planned capital expenditure (CapEx) and operating expenditure (OpEx) for key actions for target achievement related to the reduction in intensity of Scope 1 and market-based Scope 2 GHG emissions for the Tires group sector.
- Values for 2024 are reported according to the former targets for the group and the 2024 organizational structure.
Internal Carbon Pricing System
According to Continental’s interpretation of the regulatory requirements of the ESRS regarding internal carbon pricing systems, such a mechanism is not used at Continental. To incentivize reduction measures, Continental has created the option for its entities to take internal carbon shadow prices into account as a supporting factor in investment decision-making processes. The system is non-binding. Each entity independently decides whether to include the optional carbon shadow price as an additional factor when calculating the internal rate of return (IRR), which is a key performance metric for decision-making. The optional shadow price is determined based on Continental’s expectations regarding the future development of external carbon prices. Due to the non-binding nature of the system and its resulting limited application scope, estimates of the GHG emissions covered by the carbon pricing system are not representative.
Resilience Analysis
The analysis of Continental’s resilience to climate change along the entire value chain, particularly in relation to strategy and business model, is integrated into the general IRO assessment (see the General Disclosures (ESRS 2) section, Overview of material impacts, risks and opportunities subsection).
In the process of identifying and assessing risks and opportunities as part of the general IRO assessment, Continental considered various factors and scenarios. The scenarios are described in the Specifics of the IRO assessment in relation to climate change subsection in the General Disclosures (ESRS 2) section. The use of scenarios and assumptions by definition leads to uncertainties in the outcome of the analysis. In addition, the following factors have been particularly considered:
- Reduced overall greenhouse gas emissions and lower energy consumption due to a switch to low-carbon fuels;
- Improved energy efficiency;
- Increased use of renewable energies;
- Higher production share of zero-tailpipe-emission vehicles;
- Different speeds in the transition to low-carbon technologies.
To assess the resilience of Continental’s business model to the identified risks and opportunities, an assessment of the tangible risks was also performed, considering the existing management approaches, targets and key actions for target achievement related to climate change. The identification of risks is a basis for management approaches and, together with the identification of impacts and opportunities, as described in each IRO cluster, supports the prioritization of processes and measures, including investments, related to climate change mitigation and adaptation. For example, electrification measures support the mitigation of transition risks, and construction measures support the mitigation of adaptation risks.
Based on the IRO assessment and considering the associated limitations, uncertainties, time horizons and assumptions as outlined in the Processes to identify and assess material IROs subsection in the General Disclosures (ESRS 2) section, as well as taking into account the management approaches, Continental considers its business model, strategy, assets and access to financing to be resilient. The management approaches, targets and key actions for target achievement described in this section outline Continental’s capability to reduce material negative impacts, mitigate risks and seize opportunities in the short, medium and long term. Continental also assumes that these capabilities will continue to develop over time.
Further Information Related to Climate Change
Further disclosures on energy consumption and energy mix
The generation of renewable energy increased significantly in the reporting year. There was a marked rise in the Tires and ContiTech group sectors, while the spin-off of the former Automotive and Contract Manufacturing group sectors had a slightly counteracting effect.
The decrease in non-renewable energy generation was mainly due to the structural effect of the spin-off.
The lower total energy consumption from activities in high climate impact sectors, as well as the decline in revenue from activities in such sectors, likewise resulted from this structural effect.
| Further disclosures on energy consumption and energy mix | 2025 | 2024 |
| Non-renewable energy production, in MWh | 2,523,755 | 2,760,454 |
| Renewable energy production, in MWh | 34,484 | 26,652 |
| Disclosures on activities in high climate impact sectors | ||
| Energy intensity from activities in high climate impact sectors, in MWh / € millions | 364 | 214 |
| Total energy consumption from activities in high climate impact sectors, in MWh | 6,668,840 | 8,144,095 |
| Revenue from activities in high climate impact sectors, in € millions | 18,320 | 38,053 |
Definitions, assumptions and calculation methods:
Non-renewable energy production
- Includes the generation of steam from non-renewable sources in boiler houses as well as self-generated electricity from fossil sources.
- The amount of steam produced in boiler houses is calculated based on the total consumption of natural gas at the respective location minus the direct combustion of natural gas based on annual average values.
- In addition to the production of electricity from fossil sources, the extrapolation of energy production from non-renewable sources based on global natural gas consumption represents the main component of energy production from fossil sources. Other energy sources are not considered as material for this metric.
- If required, conversion factors are used to convert energy production into MWh.
- The data is collected by the locations. For certain locations, modeled calculations are used considering the number of employees and the type of operation.
Renewable energy production
- Includes the production of electricity from renewable sources such as photovoltaics.
- If required, conversion factors are used to convert energy production into MWh.
- The data is collected by the locations.
Energy intensity from activities in high climate impact sectors
- The metric is defined as the total energy consumption from activities in high climate impact sectors divided by the revenue from activities in high climate impact sectors.
- Data on energy consumption is collected in accordance with the information under the table on energy consumption and energy mix.
Total energy consumption from activities in high climate impact sectors
- Activities in the NACE code sectors A to H and L that generate revenue are considered activities in high climate impact sectors.
- Includes total energy consumption from fossil and renewable sources attributable to activities in high climate impact sectors.
- The data is collected by the locations. For certain locations, modeled calculations are used considering the number of employees and the type of operation.
Revenue from activities in high climate impact sectors
- Represents the sales presented in the Consolidated Financial Statements minus the sales from non-climate-intensive activities.
Activities in the NACE code sectors A to H and L that generate revenue are considered activities in high climate impact sectors, and are used for the calculation.
Information on sales (denominator in the calculation of the intensity of GHG emissions) can be found in the Consolidated Statement of Income of the Consolidated Financial Statements and in Notes 1 and 7 of the Notes to the Consolidated Financial Statements.Total GHG emissions
The reduction in total GHG emissions (Scopes 1, 2 and 3) was due to the changes described for each scope and was particularly linked to the spin-off of the former Automotive and Contract Manufacturing group sectors.
Total GHG emissions, |
Retrospective |
Milestones and target years |
|||||||
Base year |
2024 |
2025 |
Δ PY in % |
2025 |
2030 |
2035 |
Reduction rate (annual % of target / base year) |
||
Total GHG emissions (location-based) |
— |
101,514,749 |
84,445,665 |
‑17 |
— |
— |
— |
— |
|
Total GHG emissions (market-based) |
— |
100,251,479 |
83,460,246 |
‑17 |
— |
— |
— |
— |
|
Definitions, assumptions and calculation methods:
General information
- The figures are calculated in accordance with the assumptions and methods outlined in the corresponding tables for Scope 1 and Scope 2 as well as Scope 3 GHG emissions.
- For further information, see the metric “Gross location-based Scope 2 GHG emissions”.
Total GHG emissions (location-based)
- Total location-based GHG emissions include Scope 1, location-based Scope 2 and Scope 3 GHG emissions.
Total GHG emissions (market-based)
- Total market-based GHG emissions include Scope 1, market-based Scope 2 and Scope 3 GHG emissions.
GHG emissions intensity
The GHG emissions intensity at the level of the Continental Group increased in the reporting year due to structural effects, driven by a higher relative greenhouse gas intensity in the Tires and ContiTech group sectors compared with the spun-off former Automotive and Contract Manufacturing group sectors.
At the level of the Tires and ContiTech group sectors, the intensity remained largely stable.
Auf Ebene der Unternehmensbereiche Tires und ContiTech war die Intensität weitestgehend stabil.
| GHG emissions intensity, in million tCO2e / € millions | 2025 |
2024 |
| Location-based GHG emissions intensity | 0.004 | 0.003 |
| Market-based GHG emissions intensity | 0.004 | 0.003 |
Definitions, assumptions and calculation methods:
- Total market-based GHG emissions are divided by the sales presented in the Consolidated Financial Statements.
- The calculation of total GHG emissions is performed in accordance with the assumptions and methodologies set out in the corresponding tables for Scope 1 and Scope 2 as well as Scope 3 GHG emissions.
Information on sales (denominator in the calculation of the intensity of GHG emissions) can be found in the Consolidated Statement of Income of the Consolidated Financial Statements and in Notes 1 and 7 of the Notes to the Consolidated Financial Statements.