ContiTech
- Sales down 6.0%
- Sales down 3.3% before changes in the scope of consolidation and exchange-rate effects
- Adjusted EBIT down 19.3%
| ContiTech in € millions | 2025 | 2024 | Δ in % |
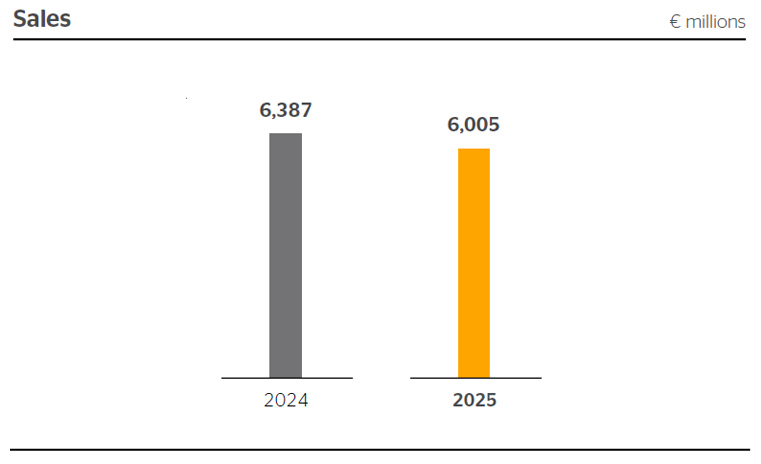
| Sales | 6,005 | 6,387 | –6.0 |
| EBITDA | 195 | 562 | –65.3 |
| in % of sales | 3.3 | 8.8 | |
| EBIT | –556 | 259 | –314.9 |
| in % of sales | –9.3 | 4.0 | |
| Depreciation and amortization1 | 751 | 303 | 147.6 |
| thereof impairment2 | 495 | 5 | 10,415.9 |
| Capital expenditure3 | 276 | 241 | 14.6 |
| in % of sales | 4.6 | 3.8 | |
| Operating assets as at Dec. 31 | 2,278 | 3,060 | –25.6 |
| Operating assets (average) | 2,695 | 3,187 | –15.4 |
| ROCE in % | –20.6 | 8.1 | |
| Number of employees as at Dec. 314 | 36,188 | 39,395 | –8.1 |
| Adjusted sales5 | 5,995 | 6,387 | –6.1 |
| Adjusted operating result (adjusted EBIT)6 | 316 | 392 | –19.3 |
| in % of adjusted sales | 5.3 | 6.1 |
1 Excluding impairment on financial investments.
2 Impairment also includes necessary reversals of impairment losses.
3 Capital expenditure on property, plant and equipment, and software.
4 Excluding trainees.
5 Before changes in the scope of consolidation.
6 Before amortization of intangible assets from purchase price allocation (PPA), changes in the scope of consolidation, and special effects
Structure
The ContiTech group sector (31% of consolidated sales) draws on its materials expertise to develop solutions for industrial applications made from rubber, metal and textiles. Its broad portfolio of hoses, conveyor belts, air springs and drive belts is designed for the operating conditions in industrial environments, which can be challenging. At the same time, ContiTech offers surface materials with an appealing look and feel for use in home and vehicle interiors. ContiTech’s industrial growth areas are primarily in energy, mining, agriculture and construction, as well as exterior and interior design. In the reporting year, the group sector was divided into five business areas:
- Industrial Solutions Americas
- Industrial Solutions APAC
- Industrial Solutions EMEA
- Original Equipment Solutions
- Surface Solutions
Business and sales performance
Sales in the ContiTech group sector decreased by 6.0% year-on-year to €6,005 million in 2025 (PY: €6,387 million). Before changes in the scope of consolidation and exchange-rate effects, sales declined by 3.3%. Two factors contributed to this: the downtrend in the automotive original-equipment business in Europe and North America and the year-on-year sales decline in the industrial and automotive replacement business due to the ongoing weak markets, particularly in the industrial environment – specifically the printing and packaging industry – and in the commercial-vehicle and off-highway business.
Adjusted EBIT
Adjusted EBIT for the ContiTech group sector fell by €76 million or 19.3% year-on-year in 2025 to €316 million (PY: €392 million), corresponding to 5.3% (PY: 6.1%) of adjusted sales.
EBIT
The ContiTech group sector reported a year-on-year decline in EBIT of €814 million or 314.9% to ‑€556 million in 2025 (PY: €259 million). The return on sales fell to ‑9.3% (PY: 4.0%). EBIT was significantly impacted by negative margin effects from declining volumes and restructuring expenses, severance payments and expenses in connection with the valuation of the OESL disposal group. By contrast, cost of sales decreased by €230 million to €4,951 million (PY: €5,181 million), due in particular to declining volumes and further significant efficiency improvements in production. Costs for wages and salaries increased, however.
The amortization of intangible assets from purchase price allocation (PPA) reduced EBIT by €41 million (PY: €48 million).
For the ContiTech group sector, total consolidated expense from special effects in 2025 amounted to €832 million (PY: €85 million). For further details, please see our comments on pages 49 and 50 regarding the special effects in 2025 and 2024.
The ROCE was ‑20.6% (PY: 8.1%).
Procurement
Prices for key chemical raw materials and semifinished products such as styrene and butadiene were volatile in 2025 but declined overall toward the end of the year due to global uncertainties. While market prices for natural rubber on the Singapore Commodity Exchange remained largely stable year-on-year, the anticipated EU Deforestation Regulation led to an increase in purchase prices for natural rubber and related input materials. Costs for steel and plastic for components remained stable or slightly increased in 2025. The introduction of tariffs in the USA, Canada and Mexico present immediate challenges in the region.
Depreciation and amortization
Depreciation and amortization increased by €448 million compared with fiscal 2024 to €751 million (PY: €303 million) and amounted to 12.5% of sales (PY: 4.7%). It included impairment totaling €495 million in 2025 (PY: €5 million). mainly due to impairment in connection with the valuation of the OESL disposal group. When depreciation was ceased for the disposal group, this had an offsetting effect on the depreciation amount.
Operating assets
Operating assets in the ContiTech group sector decreased by €782 million year-on-year to €2,278 million (PY: €3,060 million) as at December 31, 2025.
Working capital was down €316 million at €908 million (PY: €1,224 million). Inventories decreased by €277 million to €669 million (PY: €947 million). Operating receivables fell by €300 million to €767 million (PY: €1,067 million) as at the reporting date. Operating liabilities were down €261 million at €529 million (PY: €790 million).
Non-current operating assets were down €611 million at €1,652 million (PY: €2,262 million). Goodwill fell by €165 million to €464 million (PY: €629 million), mainly due to a write-down of €124 million in connection with the valuation of the OESL disposal group and currency effects of €40 million. At €1,064 million, property, plant and equipment were €335 million below the previous year’s level of €1,398 million. Other intangible assets fell by €78 million to €97 million (PY: €175 million). Amortization of intangible assets from purchase price allocation (PPA) in the amount of €41 million (PY: €48 million) reduced the value of intangible assets.
In the ContiTech group sector, the reversal of a purchase price liability recognized in profit or loss resulting from the acquisition of Printing Solutions Sweden Holding AB, Trelleborg, Sweden, in 2023 increased operating assets by €1 million. In addition, operating assets decreased by €1 million due to the first-time consolidation of a previously non-fully consolidated subsidiary.
Exchange-rate effects decreased the total operating assets of the ContiTech group sector by €138 million in the reporting year (PY: increase of €13 million).
Average operating assets in the ContiTech group sector fell by €492 million compared with fiscal 2024 to €2,695 million (PY: €3,187 million).
Capital expenditure (additions)
Additions in the ContiTech group sector increased by €35 million year-on-year to €276 million (PY: €241 million). The capital expenditure ratio was 4.6% (PY: 3.8%).
Investments were mainly made to expand production capacity in Germany, Mexico, the USA, China, Romania and Hungary. There were major additions related to the expansion of production capacity in selected growth markets for the Industrial Solutions Americas, Original Equipment Solutions, Industrial Solutions EMEA and Surface Solutions business areas. In Aguascalientes, Mexico, investments were made in the development of an additional production site for the Industrial Solutions Americas business area. In addition, investments were made in all business areas to optimize existing production processes.
Employees
The number of employees in the ContiTech group sector fell by 3,207 to 36,188 as at December 31, 2025 (PY: 39,395). This was primarily due to adjustments to production volumes.