Positive trend on the stock markets
In 2024, the stock markets were influenced by a fall in inflation, the monetary policy decisions taken by central banks and corporate earnings in the artificial intelligence technology sector. Following an uncertain start to the year, the markets stabilized and then improved. This was driven by falling energy prices, stabilized supply chains and improved global growth indicators. Robust corporate earnings and a drop in base rates supported this development in many major economies. Although central banks lowered interest rates more slowly than expected and key economies such as China and Europe continued to trend downward, this had only a limited impact on the performance of the stock markets. In fact, falling inflation rates and an easing of monetary policy led to price increases in the first half of the year.
Inflation continued to ease as the year progressed, both in the USA and in the eurozone. In response to this, central banks such as the Federal Reserve and the European Central Bank (ECB) lowered their base rates, triggering a positive reaction on the stock markets. The European export industry benefited from a weaker euro against the US dollar, which in turn positively impacted share prices.
The DAX, which reached a new all-time high of 20,426.27 points in December 2024, closed the year at 19,909.14 points. This represented an increase of 18.8% compared with the end of 2023, when it was quoted at 16,751.64 points. The EURO STOXX 50 rose by 8.3% in 2024 and ended the year at 4,895.98 points.
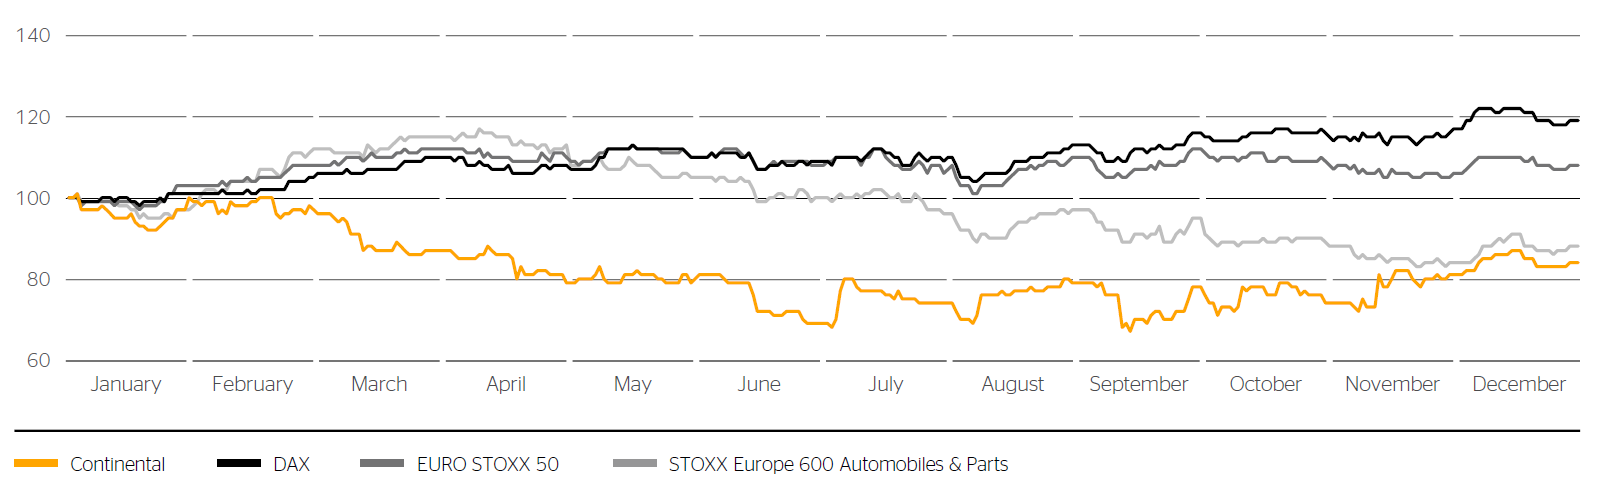
Price performance of Continental shares in 2024 versus selected stock indexes
(indexed to January 1, 2024; Data source: Bloomberg.)
Share price declines for traditional automotive stocks
The performance of automotive stocks was mixed in the first half of 2024. While certain companies benefited from an increase in demand and saw their share prices rise, other manufacturers were faced with production issues and weak sales markets. The performance of automotive stocks deteriorated over the course of the second quarter due to the political discussions concerning punitive tariffs between China and Europe. European and American automotive manufacturers suffered price losses from the middle of the year due to the decline in demand and associated weak results. In addition to macroeconomic uncertainties, the transformation to electric mobility and challenges in Asia also led to share price declines. By contrast, new automotive manufacturers, particularly from China, gained market share and saw share prices rise.
Weak demand and the transformation meant that the majority of the automotive industry was forced to revise its 2024 targets downward, causing the share prices of many listed companies to fall. The STOXX Europe 600 Automobiles & Parts recorded a 12.2% loss in 2024 compared with the end of 2023, taking it to 551.47 points.
Continental shares suffer losses
Continental’s share price performance was negative in the first quarter of 2024. After a fairly stable start to the year, the share price fell sharply toward the end of the first quarter. The share price continued to decline in the second quarter as a result of subdued expectations in the automotive industry and inflation effects, falling from €66.90 at the end of the first quarter to €52.90 at the end of the first half of the year. On April 29, 2024, the share price was marked down to reflect the dividend of €2.20 for fiscal 2023 resolved by the Annual Shareholders’ Meeting. Continental’s share price was volatile in the third quarter, with positive and negative momentum balancing each other out. The quarterly results and the announcement of the planned spin-off of the Automotive and Contract Manufacturing group sectors had a positive impact on the share price. Possible warranties in the brakes business, however, had the opposite effect. Continental shares ultimately made gains in the fourth quarter.
At the end of 2024, Continental’s shares were listed at €64.82. This represented a decrease of 15.7% compared with the year-end price of €76.92 in 2023. Taking into account a reinvestment of the dividend paid out on the distribution date, the share price fell by 12.7% in 2024.
| Continental’s key bonds outstanding as at December 31, 2024 | ||||||
|---|---|---|---|---|---|---|
| WKN/ISIN | Coupon p.a. | Maturity | Volume in € millions | Issue price | Price as at Dec. 31, 2024 | Price as at Dec. 31, 2023 |
| A2YPAE/XS2056430874 | 0.375% | June 27, 2025 | 600 | 99.802% | 98.782% | 96.117% |
| A28XTR/XS2178586157 | 2.500% | August 27, 2026 | 750 | 98.791% | 99.614% | 98.922% |
| A35138/XS2672452237 | 4.000% | March 1, 2027 | 500 | 99.658% | 102.247% | 102.347% |
| A30VQ4/XS2558972415 | 3.625% | November 30, 2027 | 625 | 100.000% | 101.760% | 101.708% |
| A351PU/XS2630117328 | 4.000% | June 1, 2028 | 750 | 99.445% | 103.362% | 103.346% |
| A383VK/XS2910509566 | 3.500% | October 1, 2029 | 600 | 99.946% | 100.995% | — |
Performance of Continental bonds
Interest rates for European corporate bonds with credit ratings similar to bonds of Continental remained stable in the period under review, despite some fluctuations due to geopolitical uncertainties and economic challenges. The ECB’s interest rate cuts led to a normalization of the yield curve with lower interest rates for shorter maturities. The prices of Continental bonds maturing by 2026 rose year-on-year at the end of 2024, while prices of bonds with longer terms remained stable.
Successful placement of a euro bond
Under the Debt Issuance Programme (DIP), one new Continental AG euro bond was successfully placed with investors in Germany and abroad on September 24, 2024. The euro bond was issued on October 1, 2024, with an interest coupon of 3.500% p.a. and a term of five years. With a nominal volume of €600 million, the issue price amounted to 99.946%. The bond was launched on the regulated market of the Luxembourg stock exchange on October 1, 2024.
Repayment of a euro bond
The price of the 1.125% Continental bond that matured on September 25, 2024, started the year at 98.016%. On the due date, the repayment was made at a nominal value of €625 million.
Positive earnings per share
Costcutting measures, price adjustments and efficiency improvements led to a positive earnings trend in the reporting year, despite weak production volumes. Consequently, net income attributable to the shareholders of the parent increased to €1,168 million in fiscal 2024 (PY: €1,156 million). Earnings per share amounted to €5.84 in 2024 (PY: €5.78).
Dividend proposal of €2.50 for fiscal 2024
The Executive Board and the Supervisory Board have resolved to propose to the Annual Shareholders’ Meeting, which will be held in Hanover on April 25, 2025, that a dividend of €2.50 per share be paid out for the past fiscal year and that the retained earnings for fiscal 2024 be allocated to other revenue reserves. For fiscal 2023, a dividend of €2.20 per share was paid out on May 2, 2024.
Share capital unchanged
As at the end of fiscal 2024, the share capital of Continental AG still amounted to €512,015,316.48. It is divided into 200,005,983 no-par-value shares with a notional value of €2.56 per share.
In line with Article 20 of Continental AG’s Articles of Incorporation, each share grants one vote at the Shareholders’ Meeting. The current Articles of Incorporation are available on our website www.continental.com under Company/Corporate Governance. All shares have the same dividend and voting rights.
Free float stable at 54.0%
As in the previous year, free float as defined by Deutsche Börse AG amounted to 54.0% as at the end of 2024. The most recent change took place on September 17, 2013, when our major shareholder, the IHO Group, Herzogenaurach, Germany, announced the sale of 7.8 million Continental shares, reducing its shareholding in Continental AG from 49.9% to 46.0%.
As at the end of 2024, the market capitalization of Continental AG amounted to €13.0 billion (PY: €15.4 billion). Market capitalization on the basis of free float averaged €7.0 billion over the last 20 trading days of the reporting year (PY: €8.0 billion). Free-float market capitalization is the decisive factor for index calculation in the regulatory framework of Deutsche Börse AG. At the end of 2024, Continental AG ranked 39th in terms of free-float market capitalization on the DAX (PY: 37th).
Free-float distribution largely stable in 2024
As at the end of the year, we once again determined the distribution of free float of Continental shares by way of shareholder identification. We were able to assign 106 million of the 108 million shares held in the form of shares or alternatively as American depositary receipts (ADRs) in the USA to 841 institutional investors, banks and asset managers across 50 countries. The identification ratio was 97.9% (PY: 99.9%).
The identified level of Continental shares held in Europe was lower than in the previous year at 47.7% of free float (PY: 51.1%). A major contributor to this year-on-year decline was the identified level of shares held by investors from the UK and Ireland, at 27.1% (PY: 31.5%).
| Continental share data | |
|---|---|
| Type of share | No-par-value share |
| German stock exchanges (regulated market) | Frankfurt (Prime Standard), Hamburg, Hanover, Stuttgart |
| German securities code number (WKN) | 543900 |
| ISIN | DE0005439004 |
| Reuters ticker symbol | CONG |
| Bloomberg ticker symbol | CON |
| Index memberships (selection) | DAX Prime All Share Prime Automobile NISAX |
| Outstanding shares as December 31, 2024 | 200,005,983 |
| Free float as at December 31, 2024 | |
| Continental’s American depositary receipt (ADR) data | |
|---|---|
| Ratio | 1 share : 10 ADRs |
| SEDOL number | 2219677 |
| ISIN | US2107712000 |
| Reuters ticker symbol | CTTAY.PK |
| Bloomberg ticker symbol | CTTAY |
| ADR Level | Level 1 |
| Trading | OTC |
| Sponsor | Deutsche Bank Trust Company Americas |
| ADRs issued as at December 31, 2024 | 26,091,400 (with 2,609,140 Continental shares deposited) |
The identified free-float holdings of German investors decreased to 5.6% in the year under review (PY: 6.9%).
The free-float holdings of Scandinavian investors rose to 3.7% in 2024 (PY: 3.3%).
French investors held 4.3% of Continental free-float shares at the end of 2024 (PY: 3.1%).
Investors in other European countries increased their share of free float slightly to 6.9% in 2024 (PY: 6.3%).
Shareholdings of investors in North America increased year-on-year in 2024. In total, they held 46.8% (PY: 44.9%) of the free float in the form of shares or ADRs.
The identified shareholdings of investors in Asia, Australia and Africa were at 3.3% at the end of 2024 (PY: 2.4%).
Continental share listings
Continental’s shares continue to be officially listed on the German stock exchanges in Frankfurt, Hamburg, Hanover and Stuttgart on the regulated market. They are also traded on other unofficial stock exchanges in Germany and in other countries around the world.
Continental ADR listings
In addition to being listed on European stock exchanges, Continental shares are traded in the USA as part of a sponsored ADR program on the over-the-counter (OTC) market. They are not admitted to the US stock market.
Continental Investor Relations online
For more information about Continental shares, bonds and credit ratings, please visit www.continental-ir.com.
| Key figures of the Continental share | ||
|---|---|---|
| € (unless otherwise specified) | 2024 | 2023 |
| Basic earnings per share | 5.84 | 5.78 |
| Diluted earnings per share | 5.84 | 5.78 |
| Dividend per share | 2.501 | 2.20 |
| Dividend payout ratio (%) | 42.81 | 38.1 |
| Dividend yield2 (%) | 4.01 | 3.2 |
| Share price at year end | 64.82 | 76.92 |
| Annual average share price | 63.01 | 67.70 |
| Share price at year high | 77.50 | 78.26 |
| Share price at year low | 51.90 | 59.20 |
| Number of outstanding shares, average (in millions) | 200.0 | 200.0 |
| Number of outstanding shares as at December 31 (in millions) | 200.0 | 200.0 |
All market prices are quotations of the Continental share in the Xetra system of Deutsche Börse AG. Data source: Bloomberg.
1 Subject to the approval of the Annual Shareholders’ Meeting on April 25, 2025.
2 Dividend per share at the annual average share price.